


Secondary sourcePainting1914
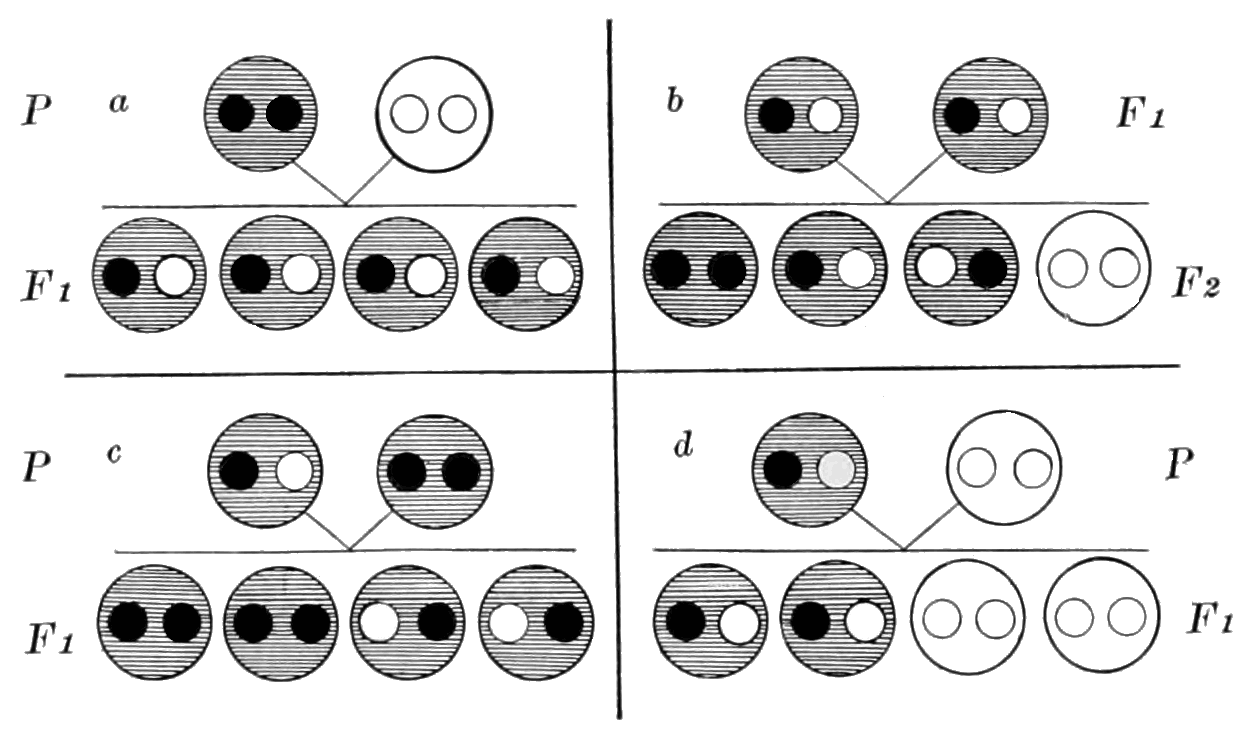
Diagram of Mendelian Inheritance
1914
A 1914 magazine diagram explaining the ratios of inheritance patterns discovered through Mendel's pea experiments.
This diagram explains the inheritance ratios that emerged from Mendel's original pea plant experiments.
About this source
What it is
This diagram was published in Popular Science Monthly in 1914. It uses four panels with circles representing gene pairs to explain inheritance across the P, F1, and F2 generations.
Why it matters
This diagram represents how scientists in the early 20th century were building on Mendel's pea experiments to explain the mathematical patterns of heredity. It shows the lasting influence of Mendel's work on the emerging science of genetics.
Look closer
- What do the black and white dots in the diagram seem to represent?
- Why might diagrams with simple shapes be useful for explaining complex ideas like inheritance?
- What questions might this diagram raise that aren't answered by the image alone?
This painting is part of the curated material that grounds the AI version of Gregor Mendel on Humy.ai — when students ask about related events, the AI can quote it and cite it.
More Gregor Mendel sources
Meet the AI Gregor Mendel →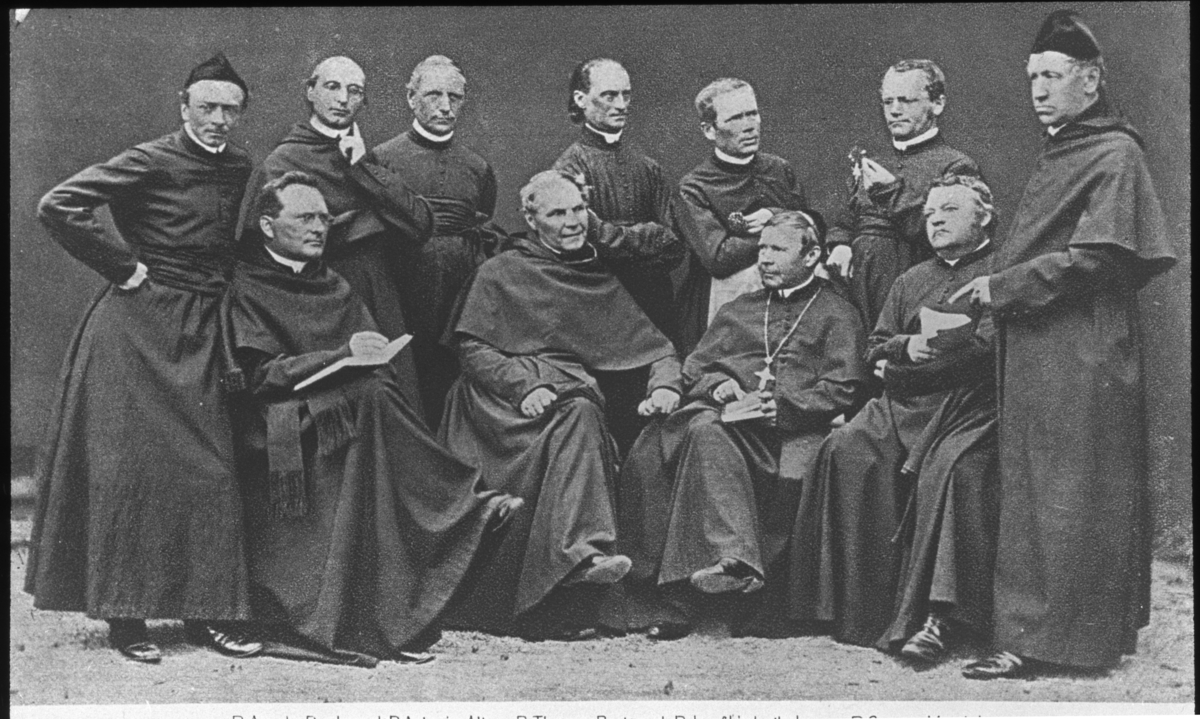 Photograph
Primary source
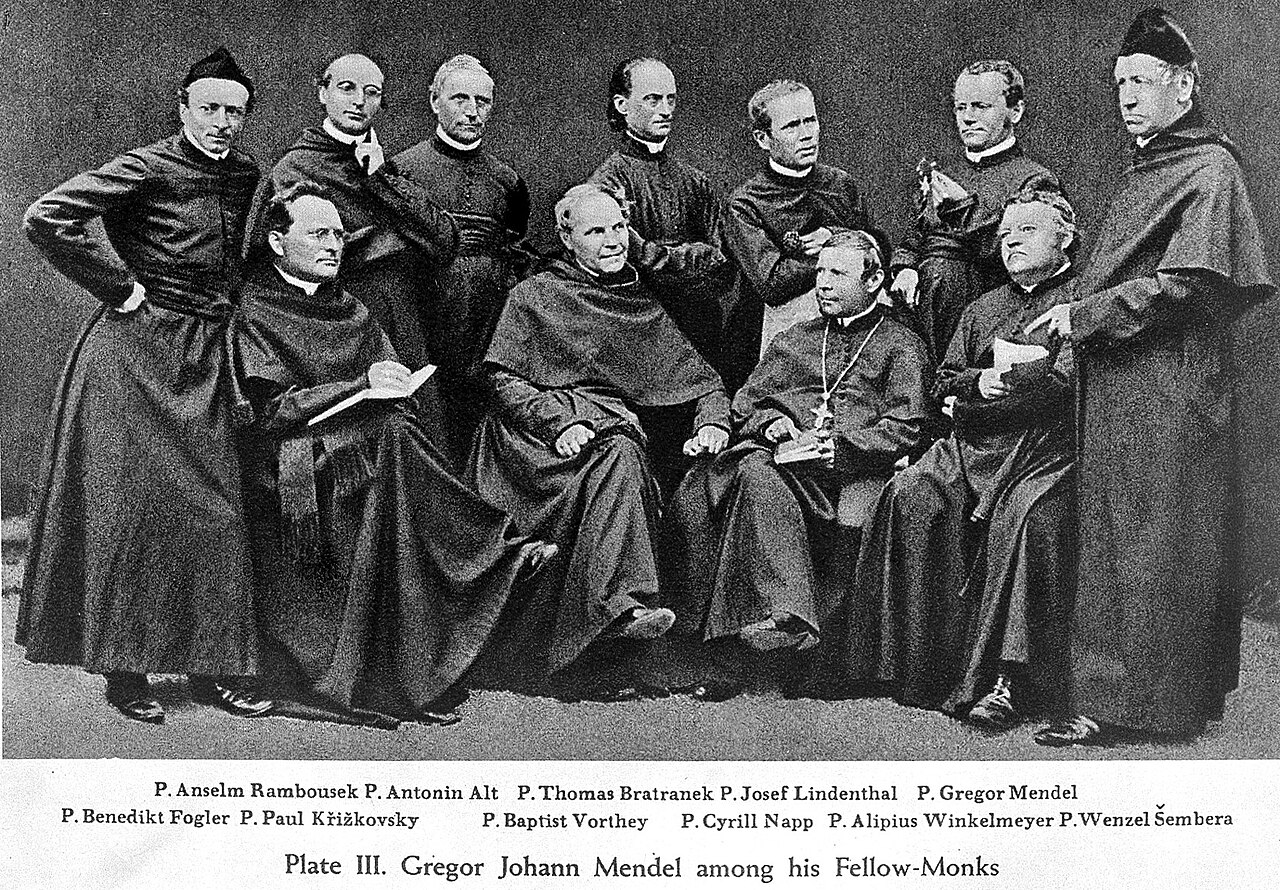
Mendel among his fellow monks
c. 1861-1864
 Book
Primary source
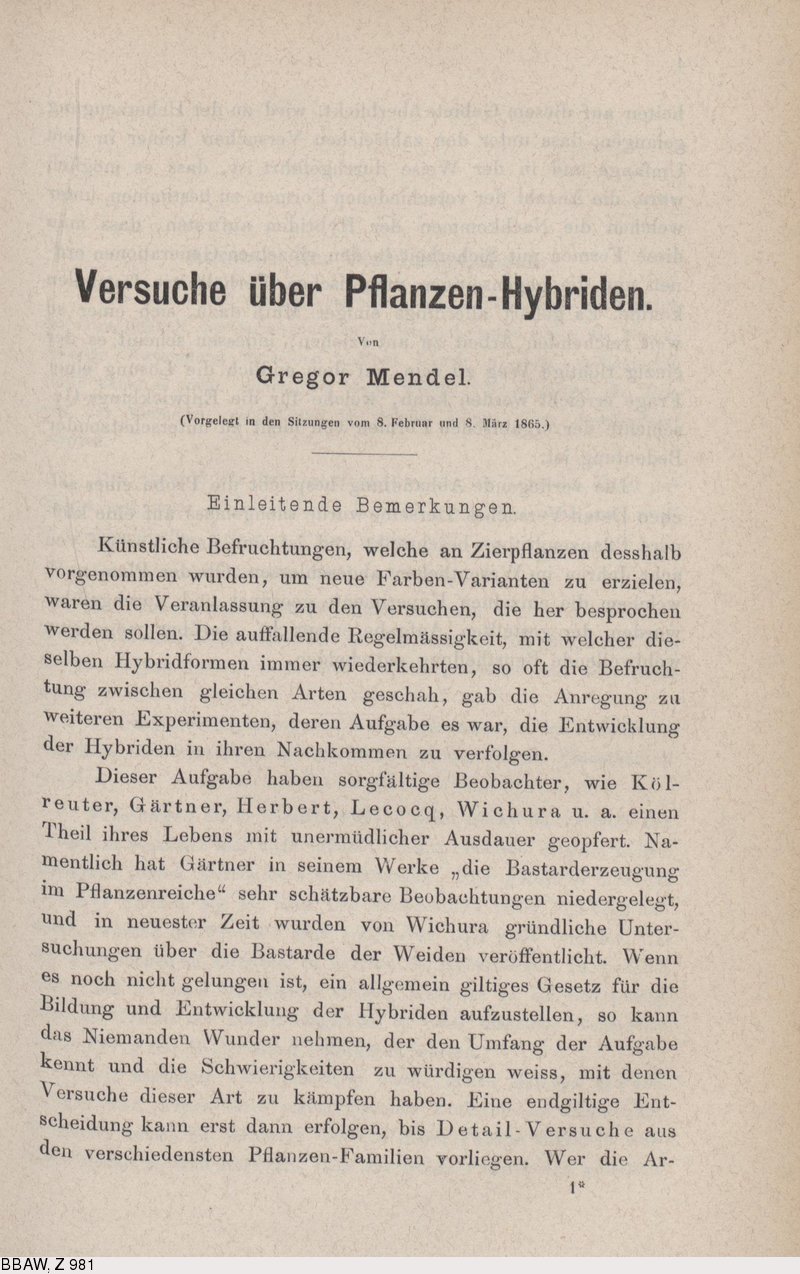
Versuche über Pflanzen-Hybriden
Gregor Mendel · 1866 (read 1865)
 Photograph
Primary source
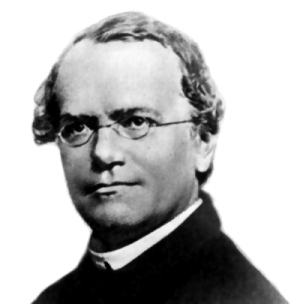
Gregor Mendel
Unknown
 Photograph
Primary source
Mendel with other monks
Unknown
 Photograph
Primary source
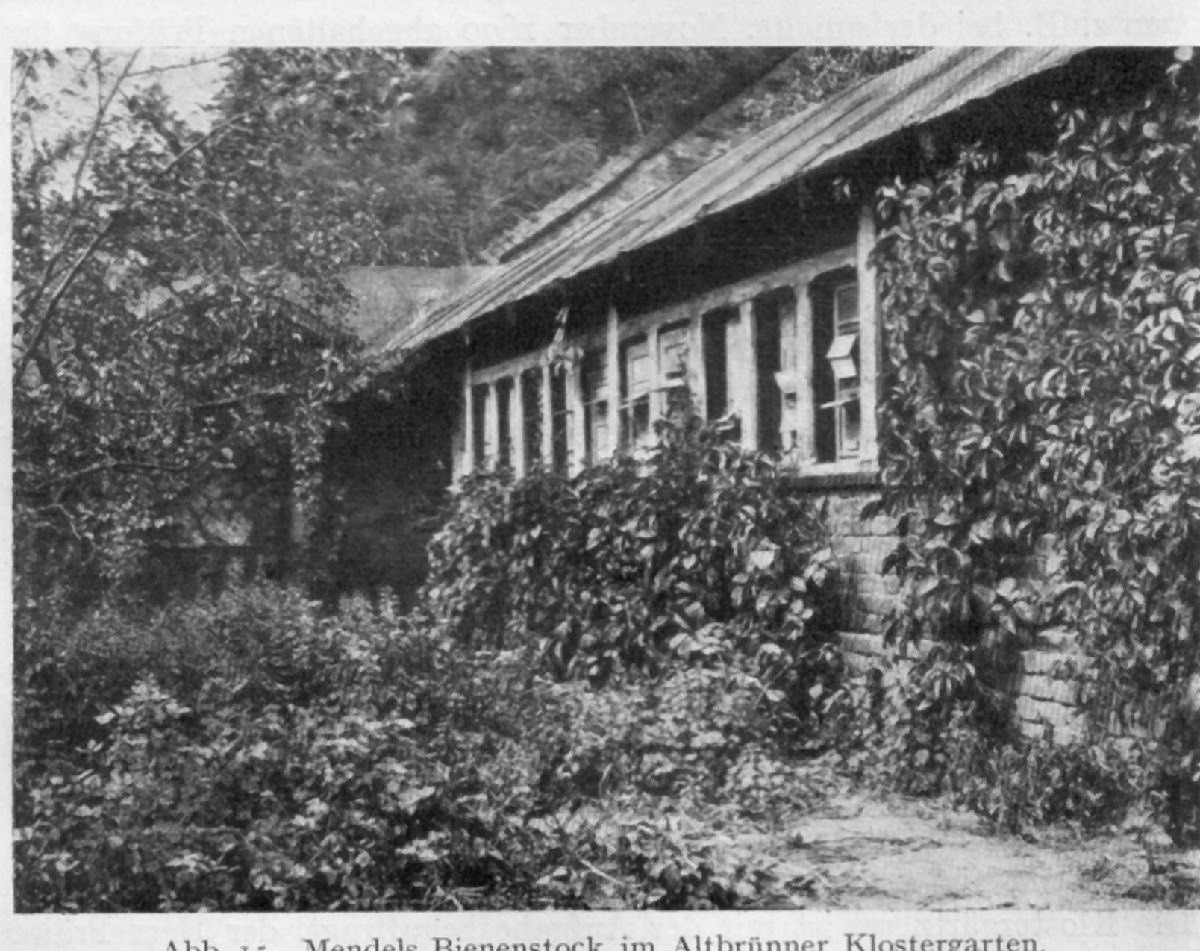
Mendel's Beehouse
Unknown · before 1909
Ready when you are
Start chatting with Gregor Mendel now.
20 messages free · No credit card · Available in 50+ languages.