


Primary sourceDocument1885
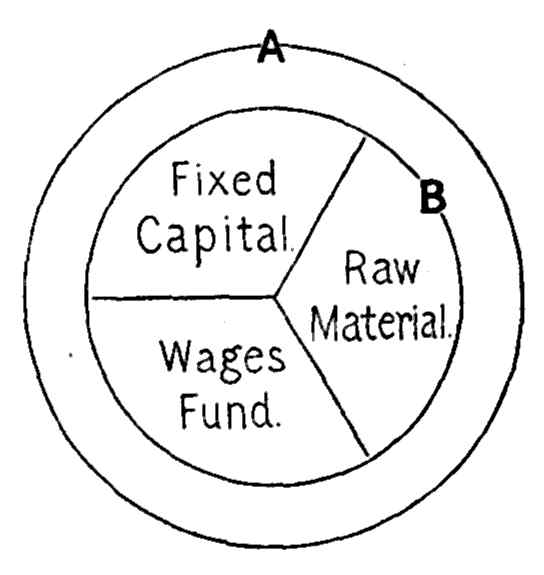
Diagram of the Wages-Fund Theory
John Stuart Mill · 1885
A line diagram of Mill's wages-fund theory, dated 1885, a reproduction made after his death.
A diagram that illustrates Mill's own wages-fund theory, linked to his economic work.
About this source
What it is
This is a black-and-white line diagram illustrating Mill's wages-fund theory, a key idea in his economics. It is dated 1885, which is after Mill's death in 1873, so it is a later reproduction rather than an original drawing by Mill. The diagram shows a large circle labeled A, with an inner circle divided into three sections: Fixed Capital, Raw Material, and Wages Fund. A point B marks the inner circle's edge.
Why it matters
The wages-fund theory was a central idea in nineteenth-century economics, and the diagram helps students see how Mill arranged capital and wages in a single picture. Later economists discussed and criticized the theory, so the diagram also reflects the debates of its time.
Look closer
- What parts of the economy does the diagram divide, and which parts are left out?
- Why might a later printing of an old idea be useful for teaching?
- How could a simple picture make a complicated theory easier or harder to understand?
This document is part of the curated material that grounds the AI version of John Stuart Mill on Humy.ai — when students ask about related events, the AI can quote it and cite it.
More John Stuart Mill sources
Meet the AI John Stuart Mill → Book
Primary source
On Liberty
John Stuart Mill · 1859
 Book
Primary source
Utilitarianism
John Stuart Mill · 1861
 Book
Primary source
The Subjection of Women
John Stuart Mill · 1869
 Book
Primary source
Considerations on Representative Government
John Stuart Mill · 1861
Primary source
Autobiography
John Stuart Mill · 1873 (written; published posthumously)
Ready when you are
Start chatting with John Stuart Mill now.
20 messages free · No credit card · Available in 50+ languages.