


Secondary sourceDocument1841-1849
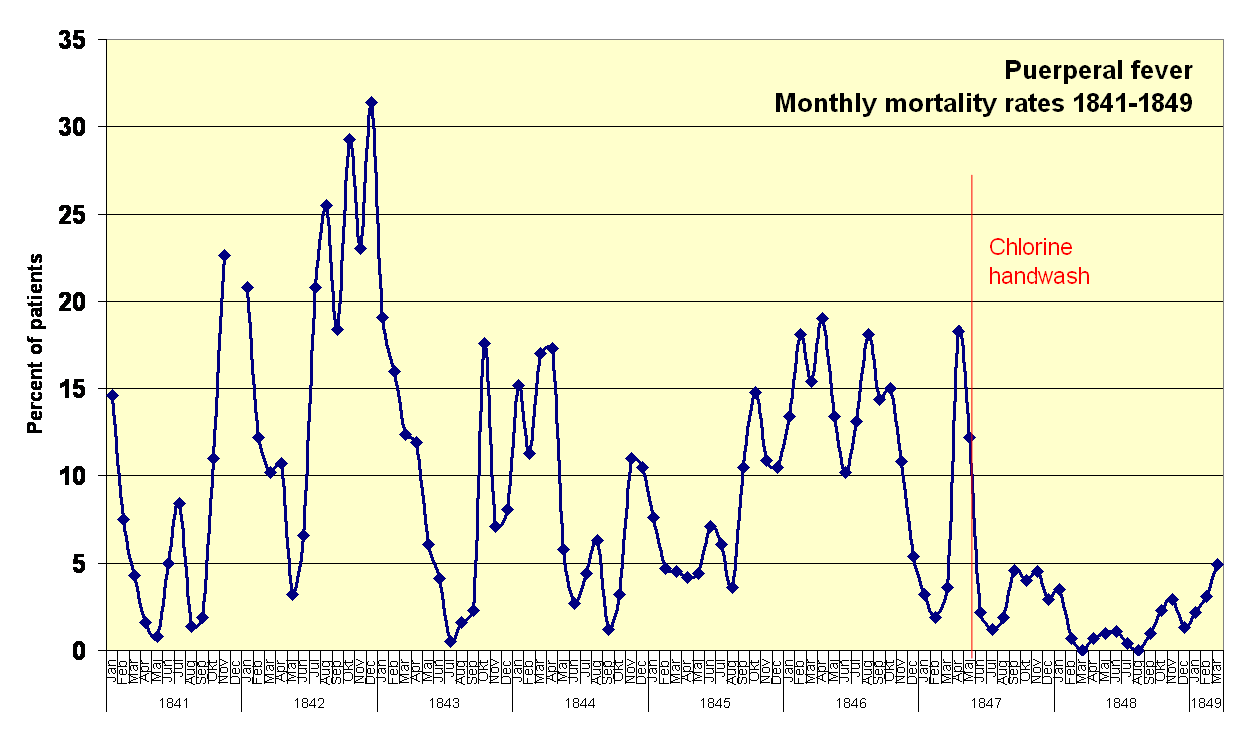
Puerperal Fever Monthly Mortality Rates 1841-1849
Power.corrupts · 1841-1849
A modern chart based on Semmelweis's own published data, showing death rates drop sharply after he introduced chlorine handwashing in 1847.
This chart visualizes Semmelweis's own mortality data proving the effectiveness of his handwashing policy.
Free Humy account · No credit card · 120,912 sources to read
About this source
What it is
This is a modern line graph drawn from the mortality figures that Semmelweis himself published, covering the First Obstetrical Clinic at the Vienna General Hospital from 1841 to 1849. It shows monthly death rates from puerperal fever among birthing women.
Why it matters
The chart illustrates the core evidence behind Semmelweis's discovery: death rates that had reached around 31 percent fell dramatically after he introduced chlorine handwashing in May 1847. This is the data that should have convinced his contemporaries, yet his employment was still terminated in 1849.
Look closer
- What does the sharp drop in the graph after the chlorine handwashing line tell you?
- Why might such clear evidence still have failed to persuade many doctors at the time?
- How is presenting data in a chart different from presenting it in a table of numbers?
This document is part of the curated material that grounds the AI version of Ignaz Semmelweis on Humy.ai — when students ask about related events, the AI can quote it and cite it.
More Ignaz Semmelweis sources
Browse all 93 →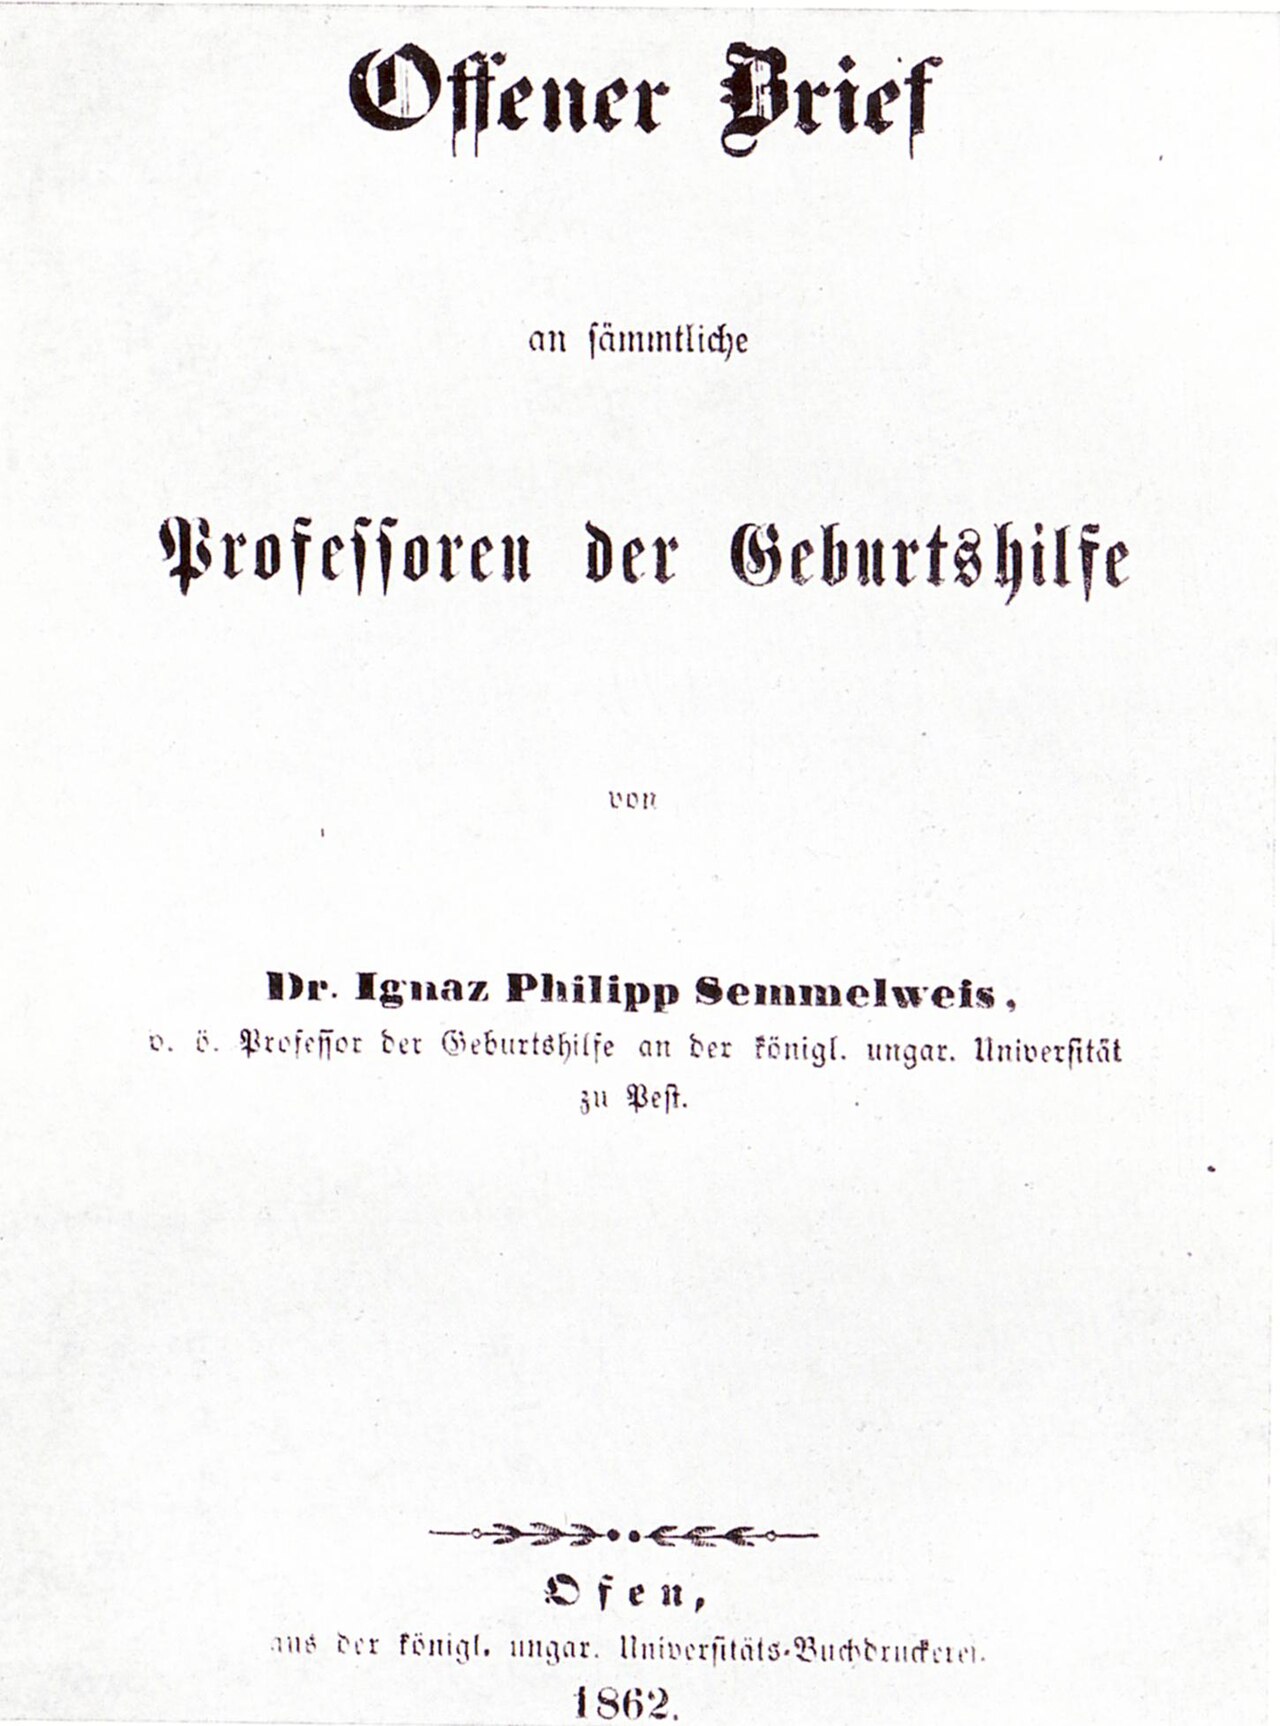 Letter
Primary source
Open Letter to All Professors of Obstetrics
Ignaz Semmelweis · 1862
 Document
Primary source
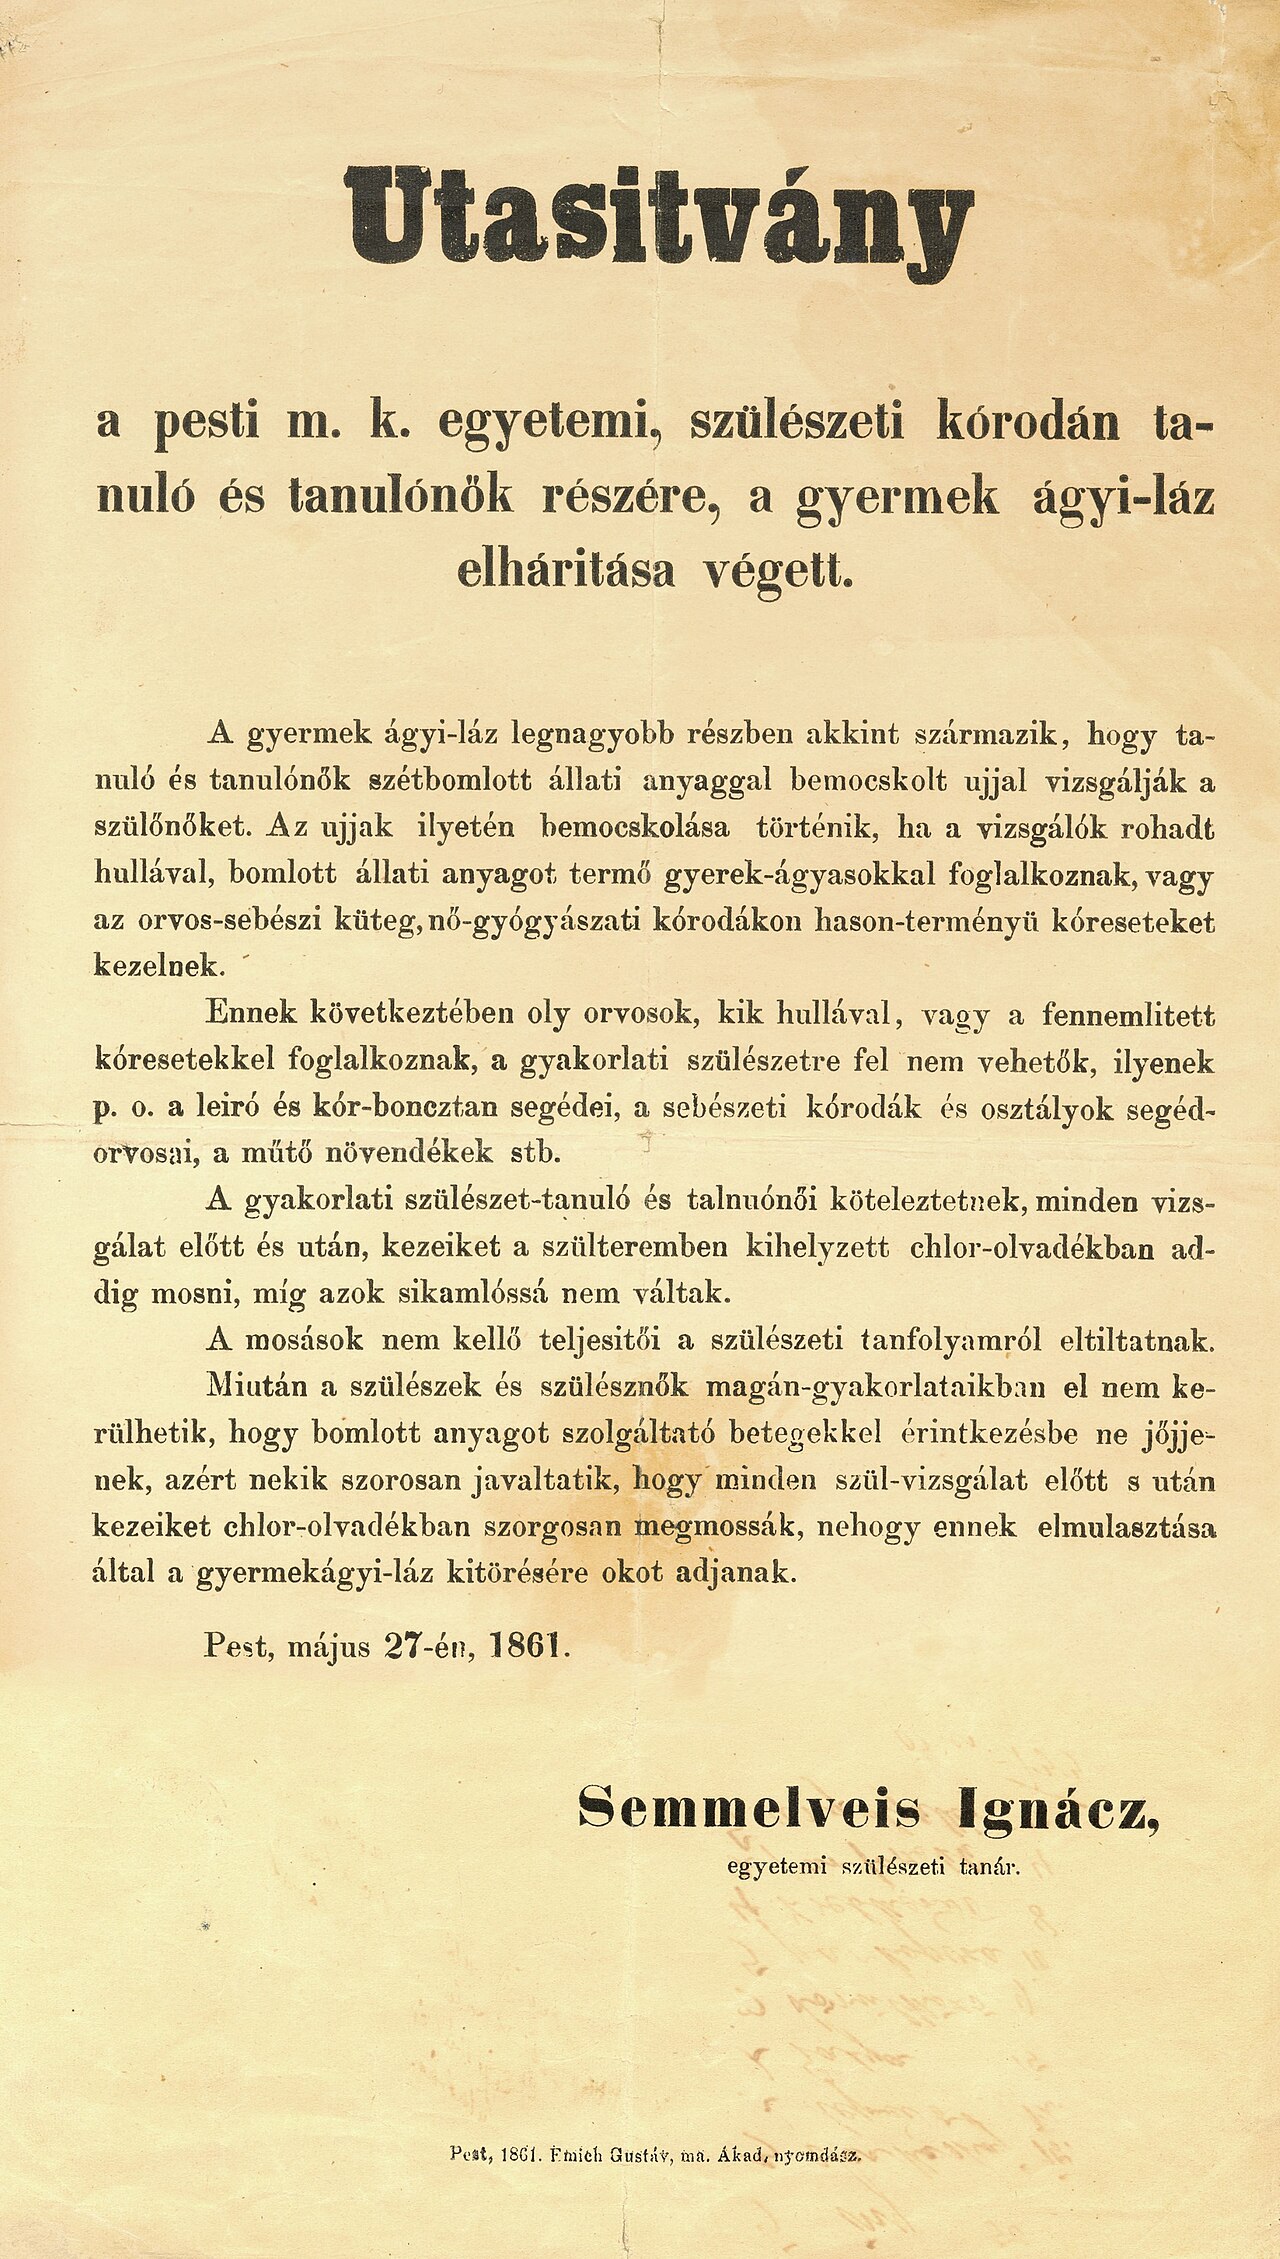
Instructions to Students at the Pest Obstetrics Clinic
Ignaz Semmelweis · 27 May 1861
 Photograph
Primary source
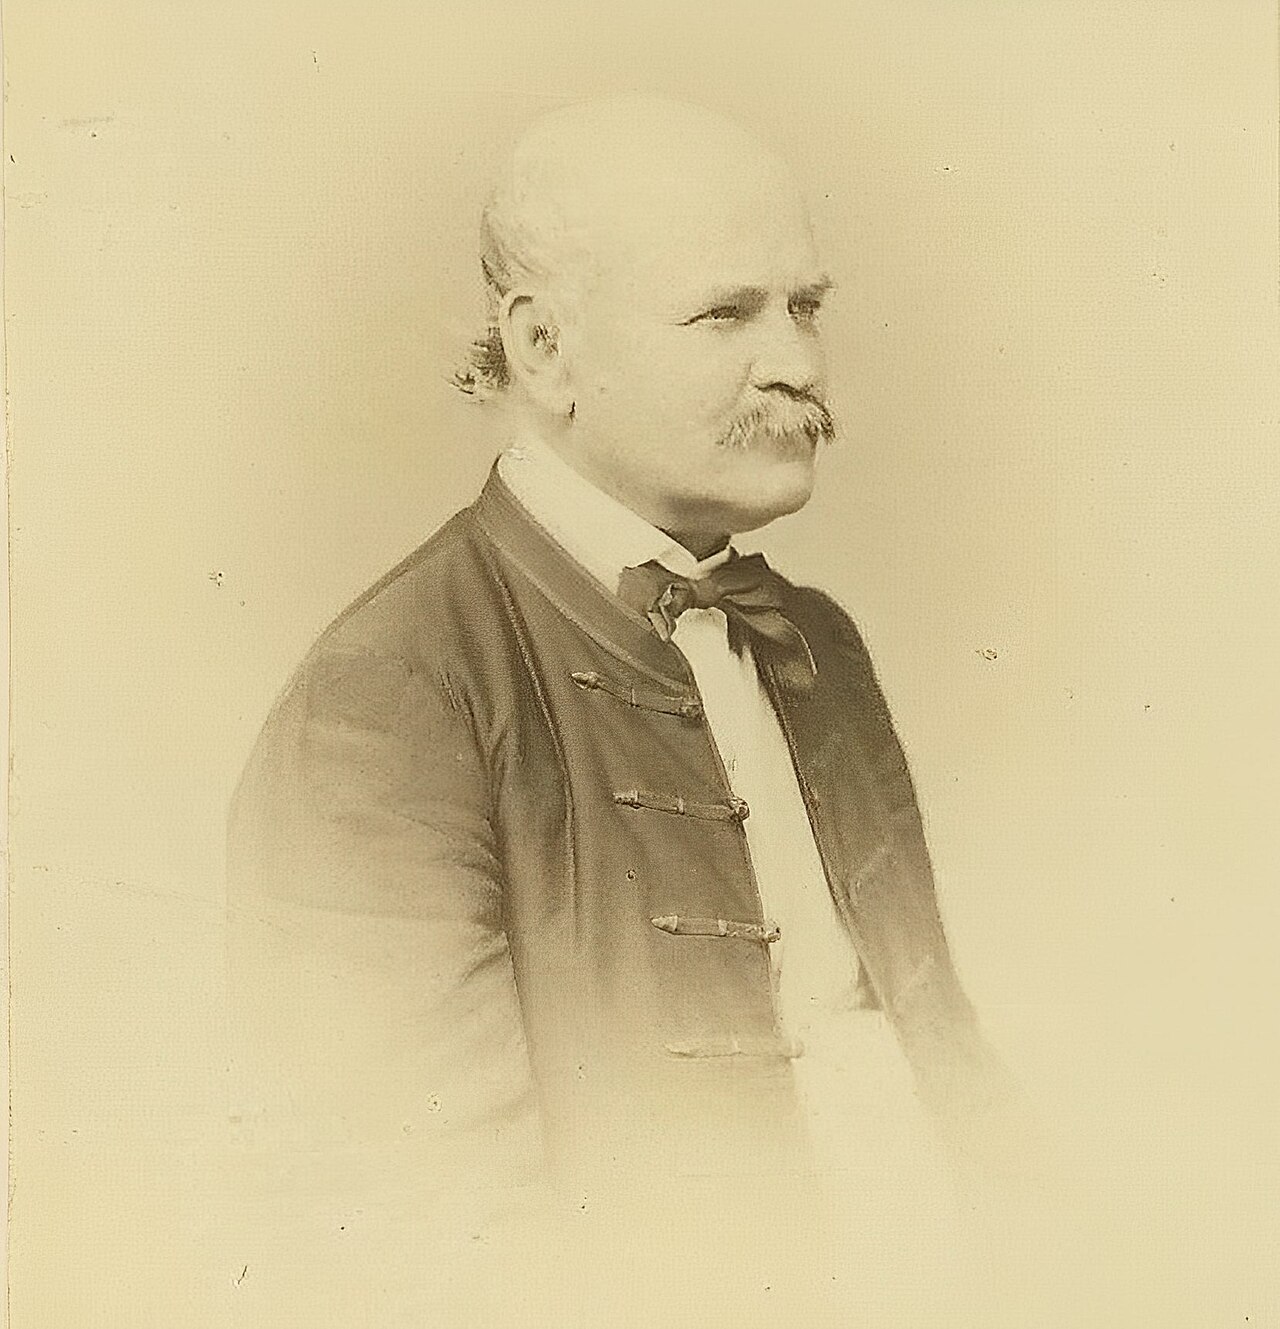
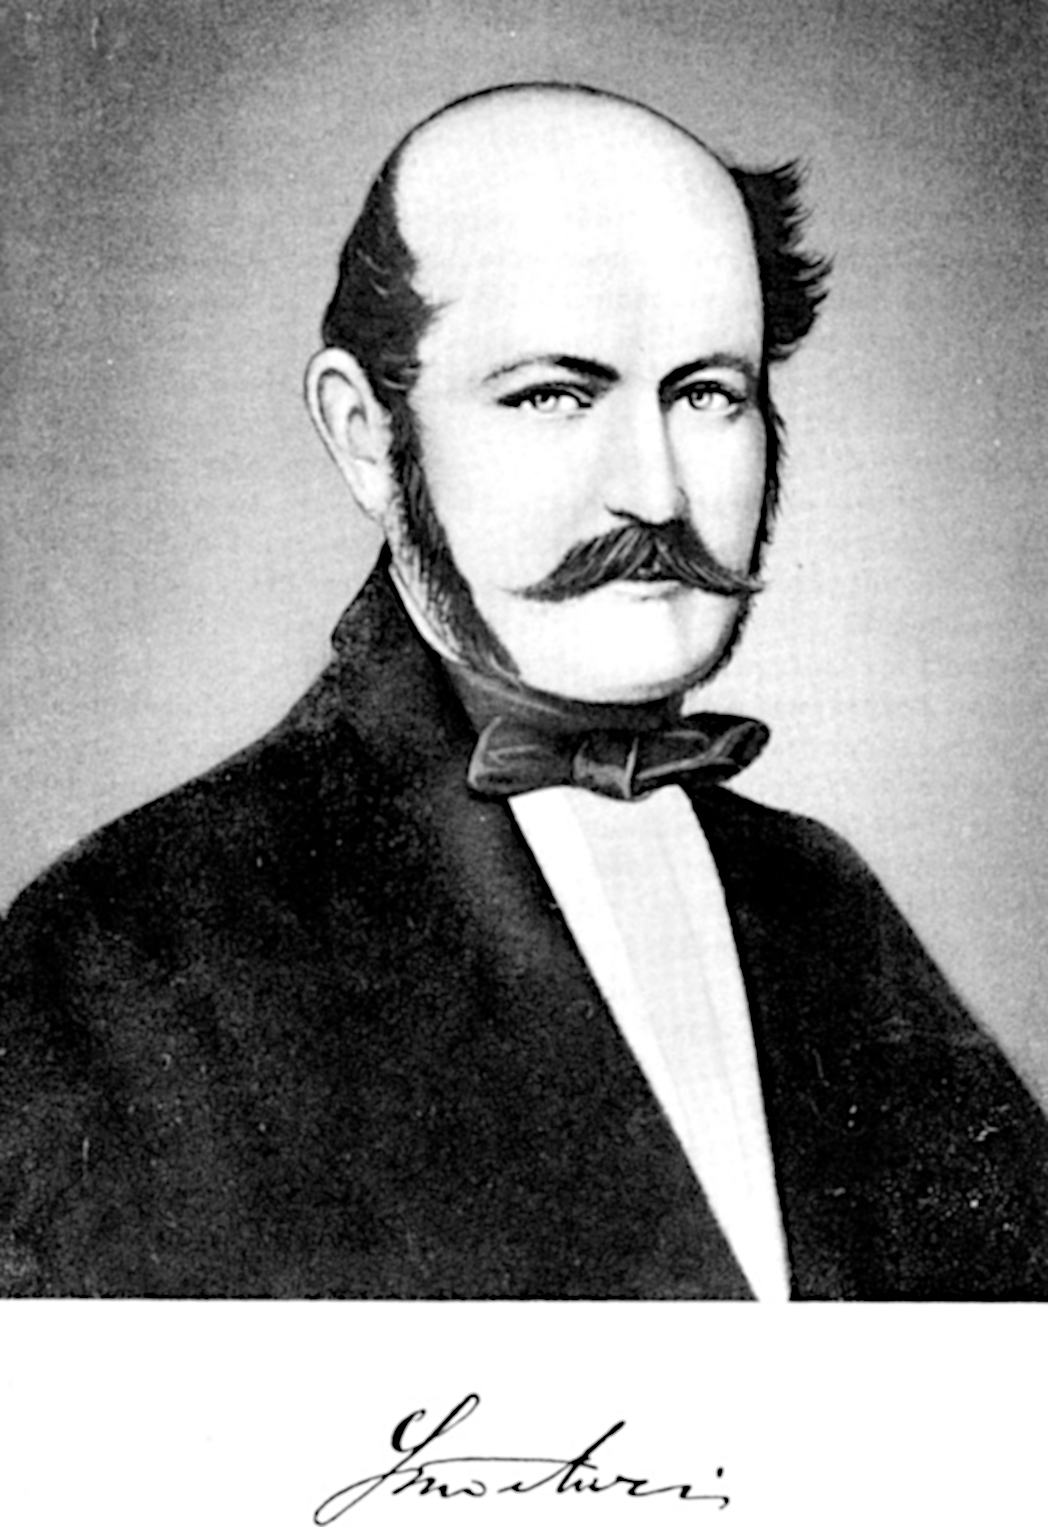
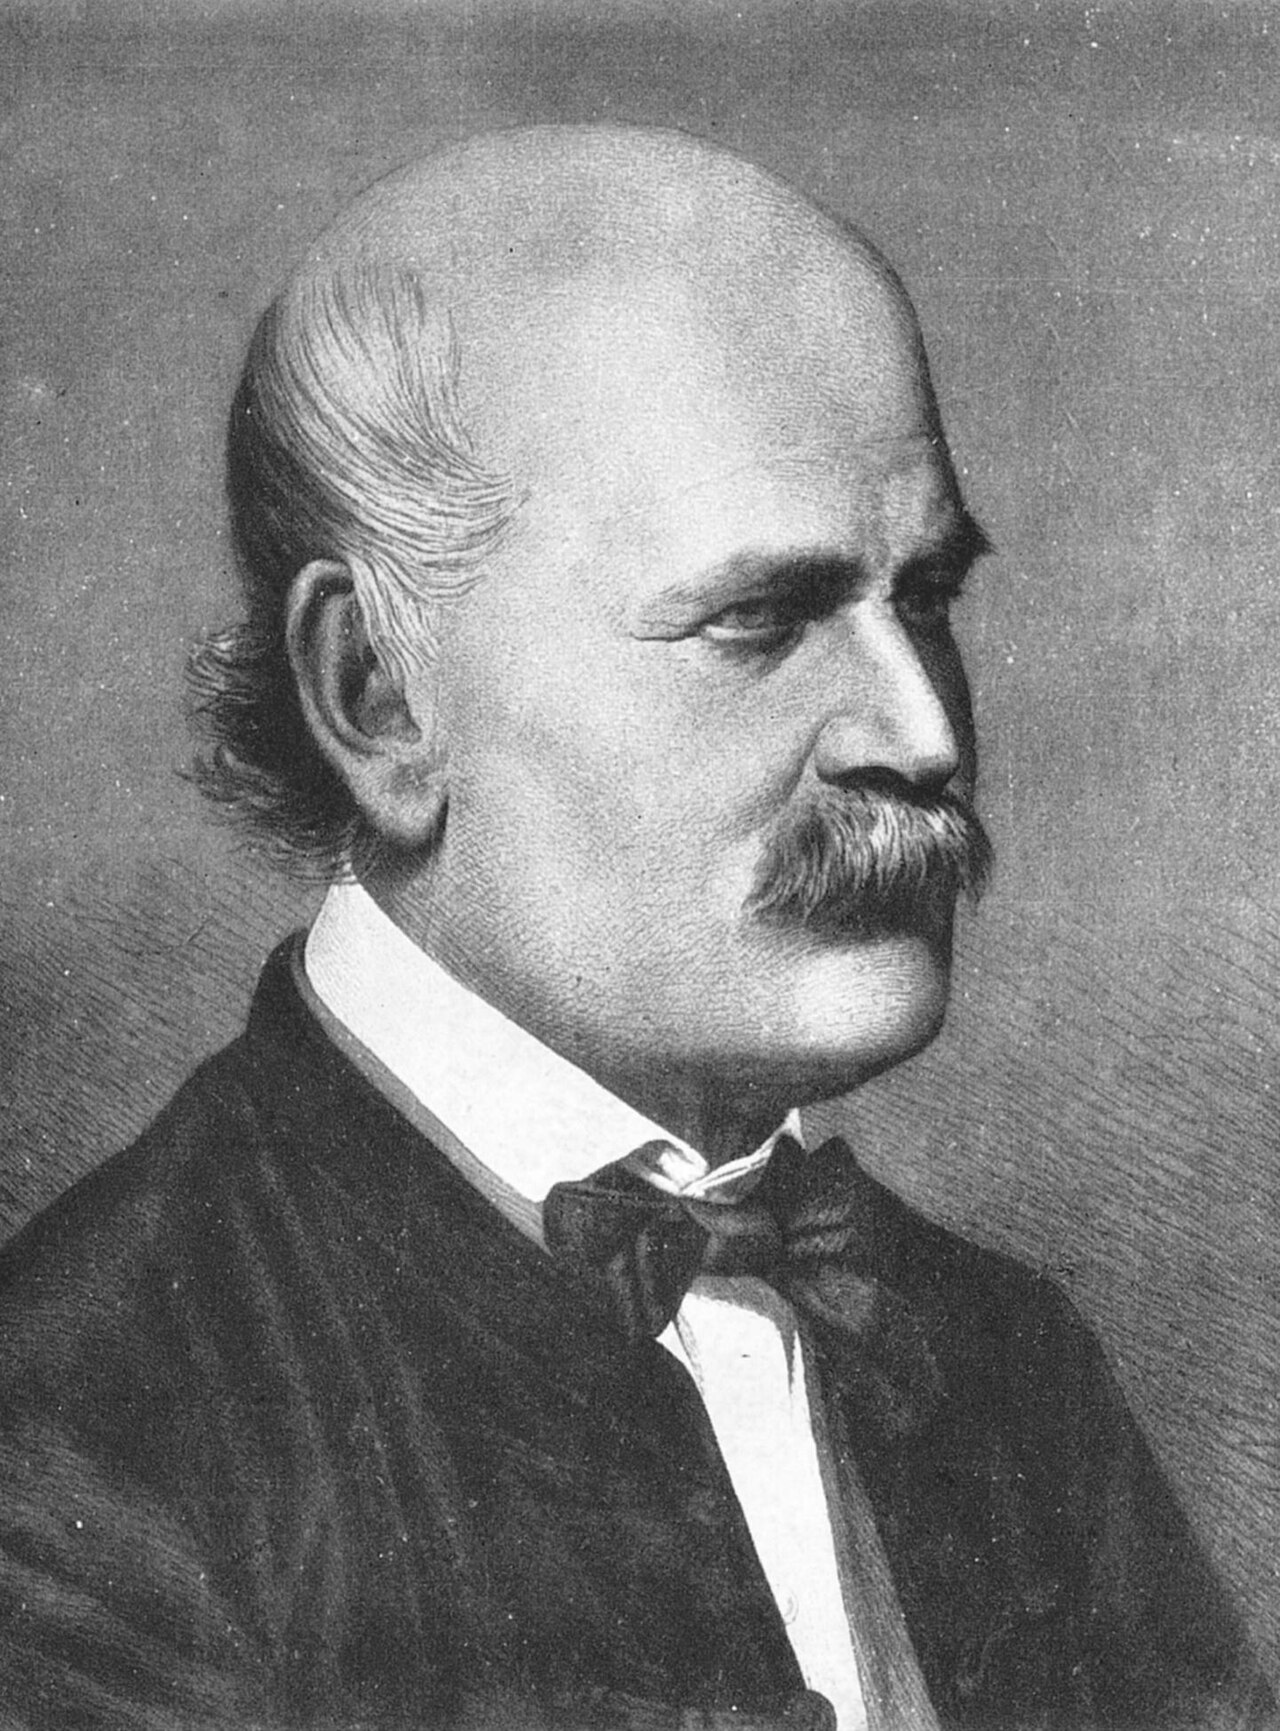
Portrait of Ignaz Semmelweis
Borsos & Doctor · 1860
 Letter
Primary source
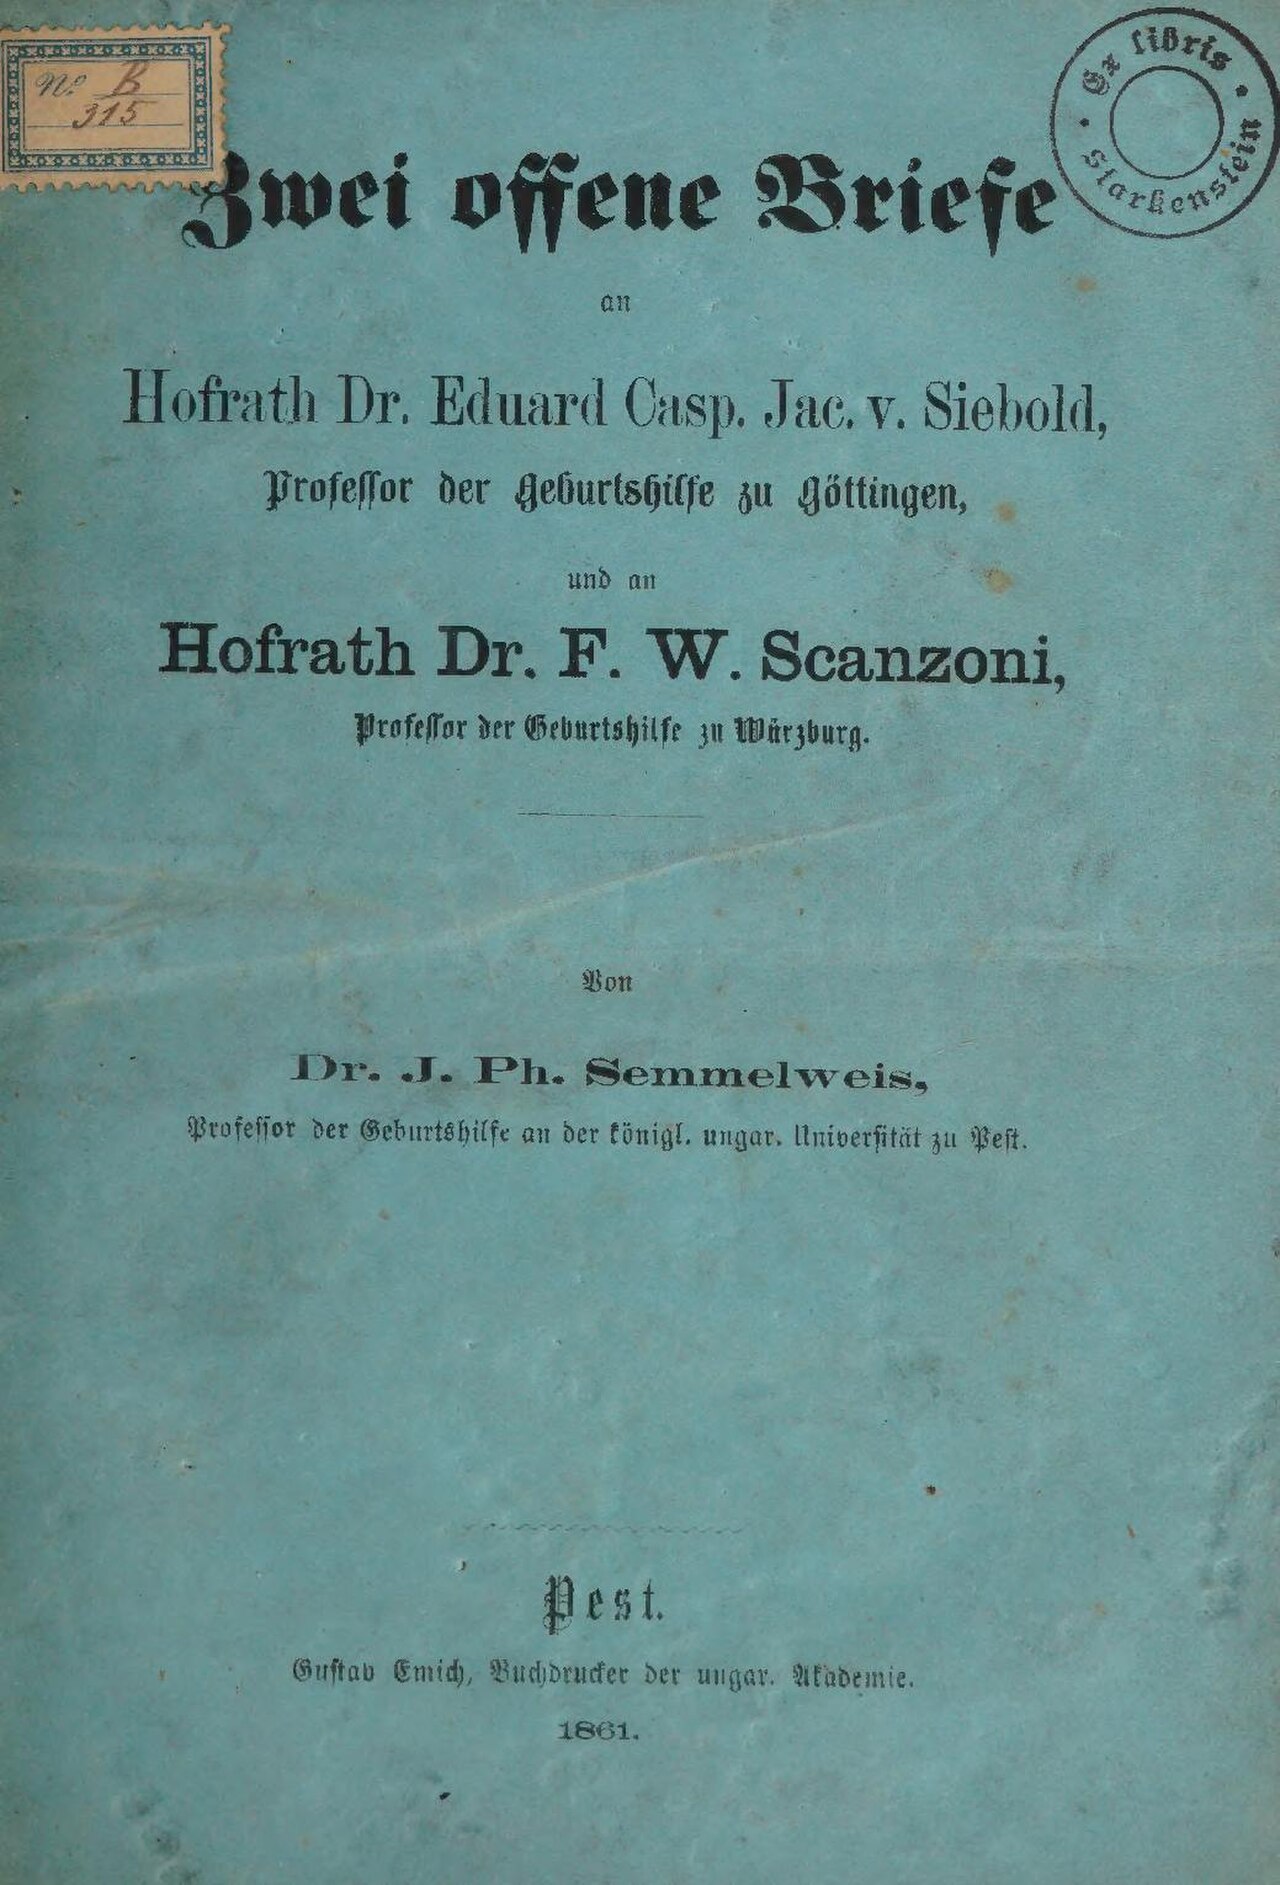
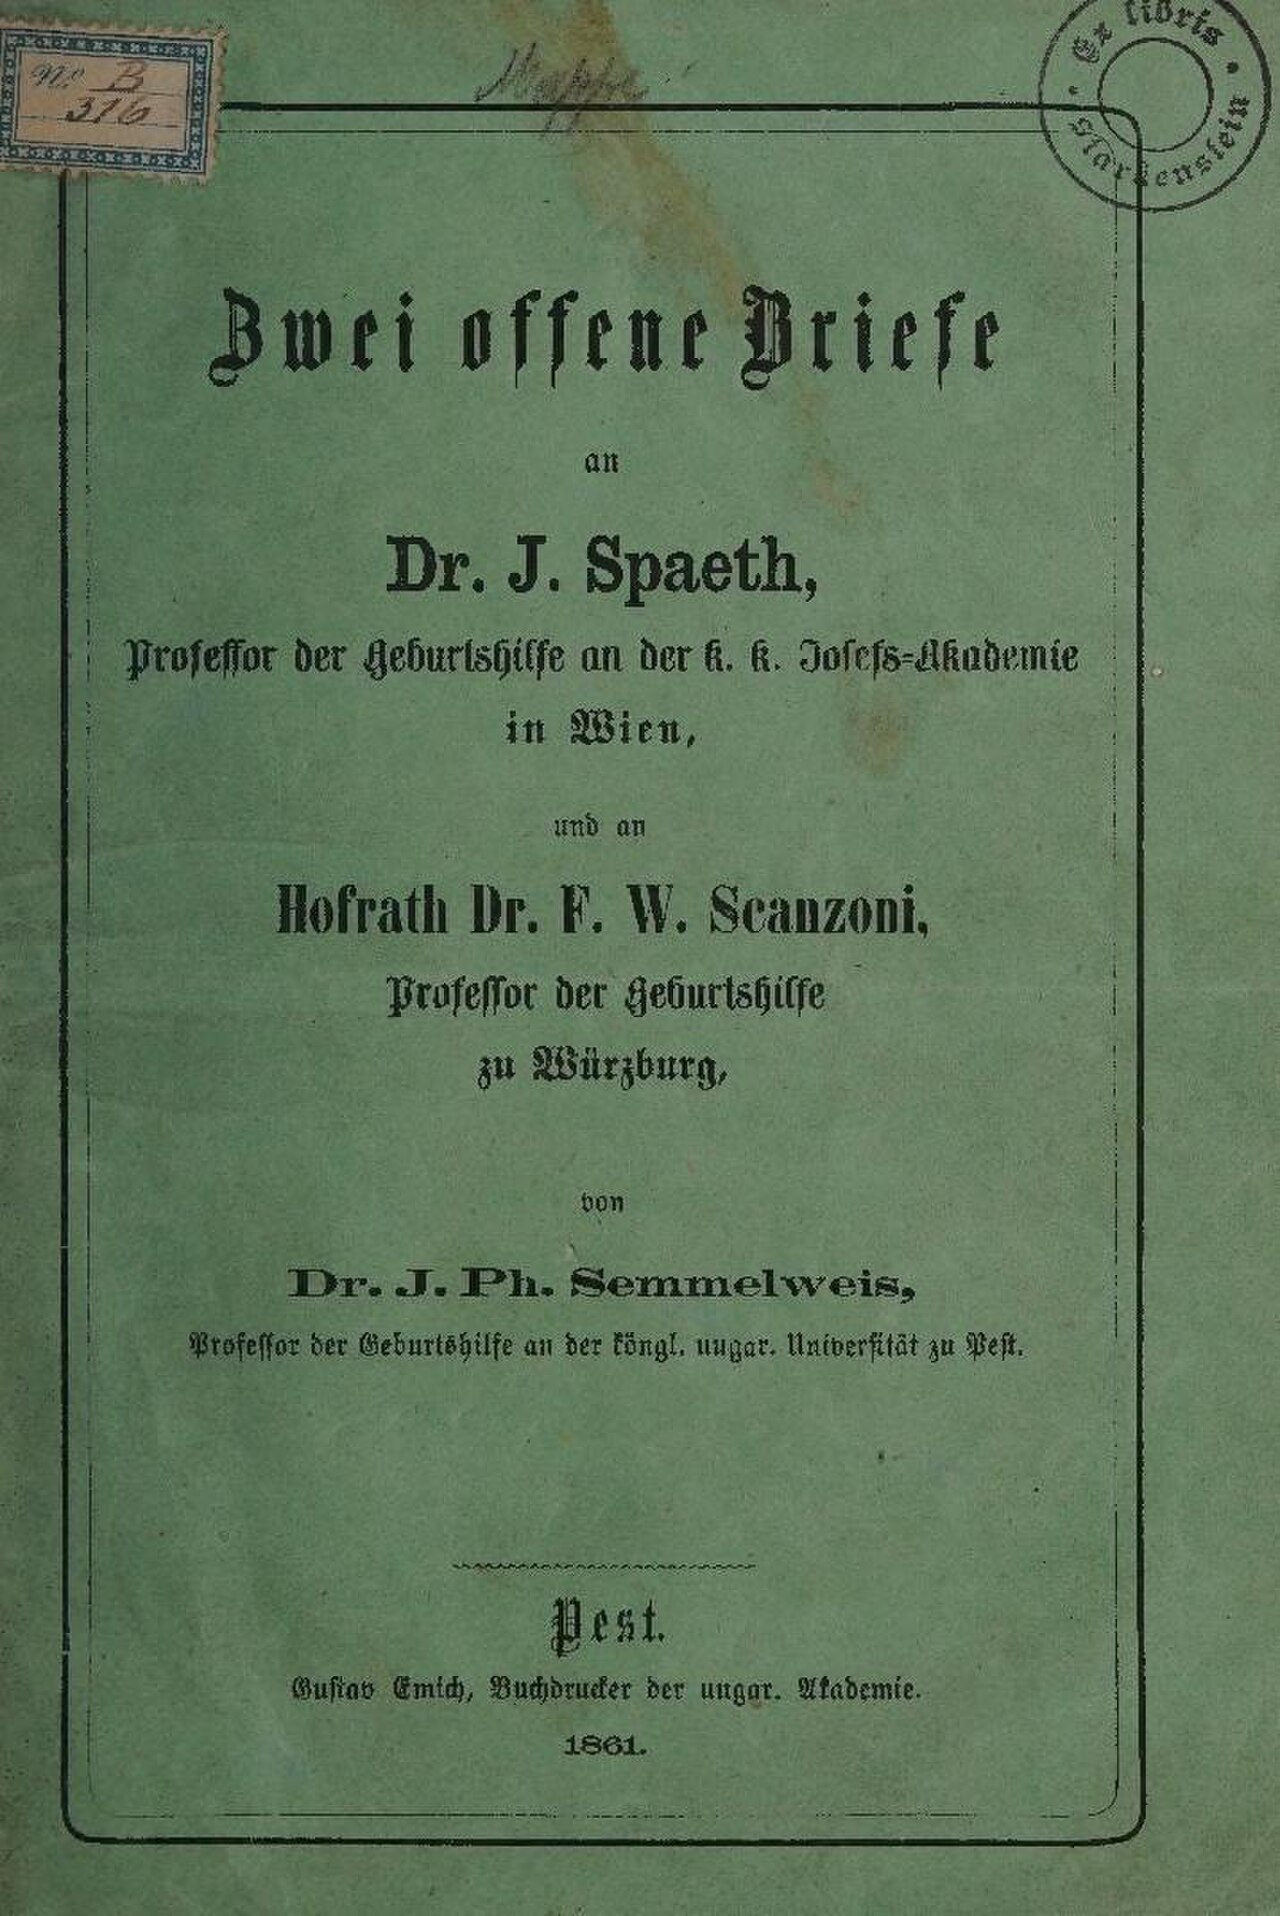
Two Open Letters to Siebold and Scanzoni
Ignaz Philipp Semmelweis · 1861
Free account
Read every Ignaz Semmelweis source
Sign up free →
Ready when you are
Start chatting with Ignaz Semmelweis now.
20 messages free · No credit card · Available in 50+ languages.