


Secondary sourceArtifact
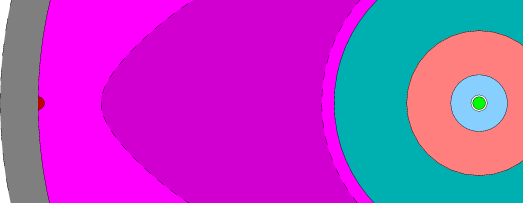
Schematic Cross-Section of the Gadget
User:Kwantus
A later diagram showing the internal layers of the first atomic bomb, whose implosion lens design von Neumann helped model.
Illustrates the implosion lens design that von Neumann's mathematics helped make possible.
About this source
What it is
This is a modern schematic drawing showing a cross-section of the 'Gadget,' the first atomic bomb, tested at the Trinity site during the Manhattan Project. It was created by a Wikipedia contributor using technical data from the Nuclear Weapon Archive, not an original wartime document.
Why it matters
The diagram illustrates the implosion design, a key innovation of the Manhattan Project. John von Neumann contributed crucial mathematical modeling of the explosive lenses needed to compress the bomb's core evenly. This image helps explain the physics and engineering behind a weapon that changed the course of history and the role of mathematicians like von Neumann in wartime science.
Look closer
- What do the different colored layers seem to represent?
- Why might a modern illustrator need to reconstruct this diagram rather than use an original?
- What does this image leave out about the people and decisions behind the bomb's design?
This artifact is part of the curated material that grounds the AI version of John von Neumann on Humy.ai — when students ask about related events, the AI can quote it and cite it.
More John von Neumann sources
Browse all 31 → Photograph
Primary source
John von Neumann at Los Alamos
Los Alamos National Laboratory · 1940s
 Photograph
Primary source
John von Neumann ID Badge
 Artifact
Primary source
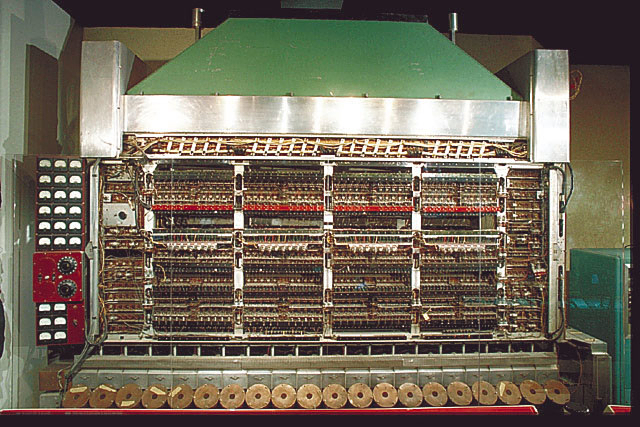
IAS Machine
Electronic Computer Project, Institute for Advanced Study · 1946–1952
 Photograph
Primary source
Oppenheimer and von Neumann Before the IAS Computer
Jeremy Norman Collection of Images · 10 June 1952
Free account
Read every John von Neumann source
Sign up free →
Ready when you are
Start chatting with John von Neumann now.
20 messages free · No credit card · Available in 50+ languages.