


Primary sourceDocument1885
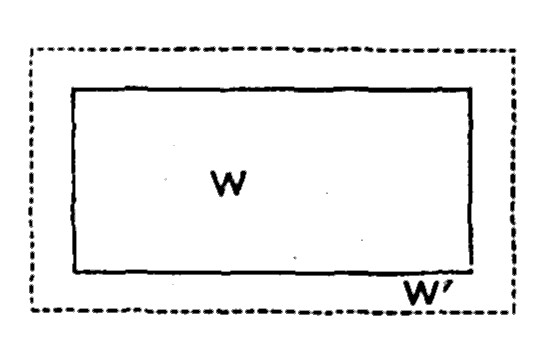
Wealth rectangles diagram
John Stuart Mill · 1885
A hand-drawn diagram of two nested rectangles illustrating Mill's economic ideas, shown in an 1885 reproduction.
A diagram linked to Mill's economic ideas, showing how he presented his theories visually.
About this source
What it is
This is a hand-drawn diagram of two nested rectangles. A solid rectangle labeled W sits inside a larger dashed rectangle labeled W' at its lower right corner. The image is dated 1885, after Mill's death in 1873, so it is a later printing of his diagram rather than the original.
Why it matters
The diagram is linked to Mill's economic thinking. Because it uses simple shapes and letters, it shows how economists of the period tried to express ideas about wealth in visual form.
Look closer
- What do the two rectangles seem to represent, and how are they related?
- Why might a diagram need labels to be understood?
- What would a student need to know beyond this picture to understand the idea behind it?
This document is part of the curated material that grounds the AI version of John Stuart Mill on Humy.ai — when students ask about related events, the AI can quote it and cite it.
More John Stuart Mill sources
Meet the AI John Stuart Mill → Book
Primary source
On Liberty
John Stuart Mill · 1859
 Book
Primary source
Utilitarianism
John Stuart Mill · 1861
 Book
Primary source
The Subjection of Women
John Stuart Mill · 1869
 Book
Primary source
Considerations on Representative Government
John Stuart Mill · 1861
Primary source
Autobiography
John Stuart Mill · 1873 (written; published posthumously)
Ready when you are
Start chatting with John Stuart Mill now.
20 messages free · No credit card · Available in 50+ languages.