


Secondary sourceDocument
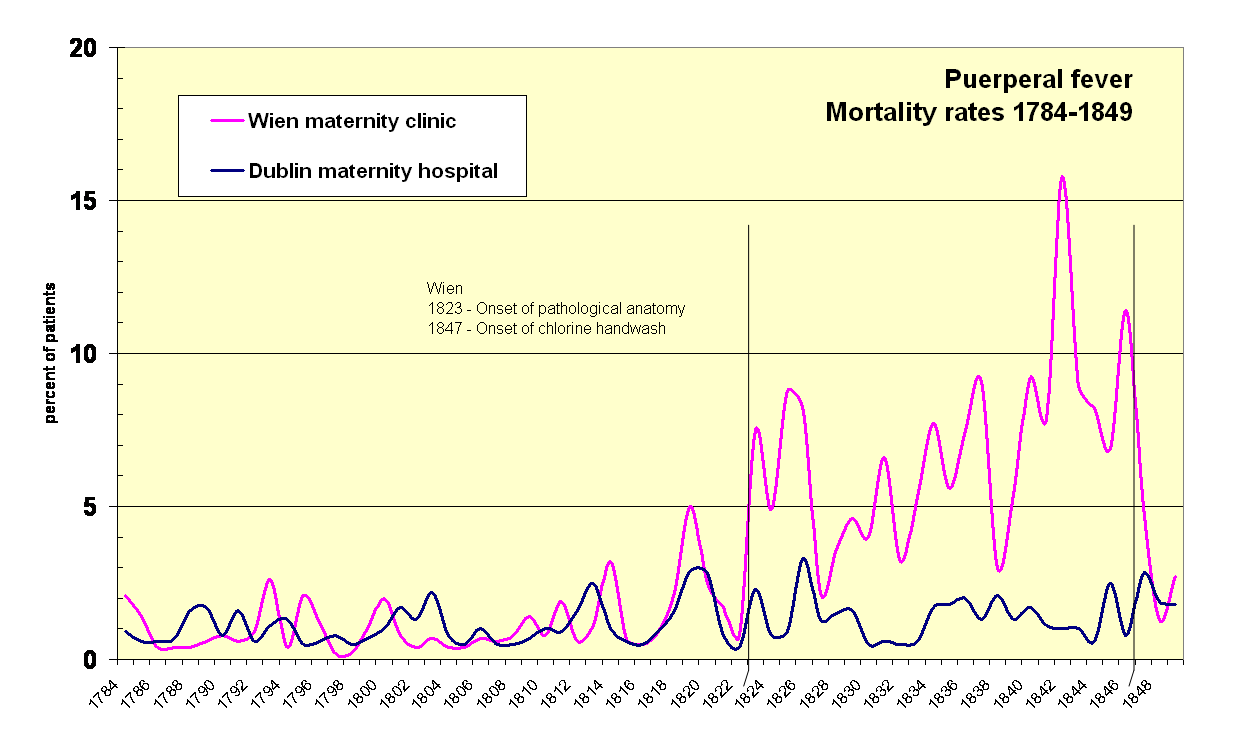
Yearly Puerperal Fever Mortality Rates, Vienna and Dublin, 1784-1849
Power.corrupts
A modern chart presenting childbed fever death rates in Vienna and Dublin to illustrate Semmelweis's argument linking autopsies to the disease.
A modern chart reconstructing the mortality evidence Semmelweis used to argue for his theory on childbed fever.
About this source
What it is
This is a modern chart, created by a Wikimedia contributor, plotting yearly puerperal (childbed) fever mortality rates in Vienna and Dublin from 1784 to 1849. It is based on data Semmelweis used to support his theory.
Why it matters
The chart illustrates the evidence Semmelweis relied on: the rise in deaths from childbed fever in Vienna after pathological anatomy, and the increase in autopsies, became common there in 1823. Comparing Vienna with Dublin, where this was less common, helped him argue that contact with corpses during autopsies was spreading infection to mothers.
Why it matters
This visual analysis, though created long after Semmelweis's time, helps modern students understand the statistical reasoning behind his conclusions, which were revolutionary but rejected by many of his contemporaries.
Look closer
- What pattern in the data would have caught Semmelweis's attention?
- Why is comparing two different cities useful for testing an idea like this?
- Since this chart was made recently, what might be missing compared to Semmelweis's own records?
This document is part of the curated material that grounds the AI version of Ignaz Semmelweis on Humy.ai — when students ask about related events, the AI can quote it and cite it.
More Ignaz Semmelweis sources
Browse all 93 →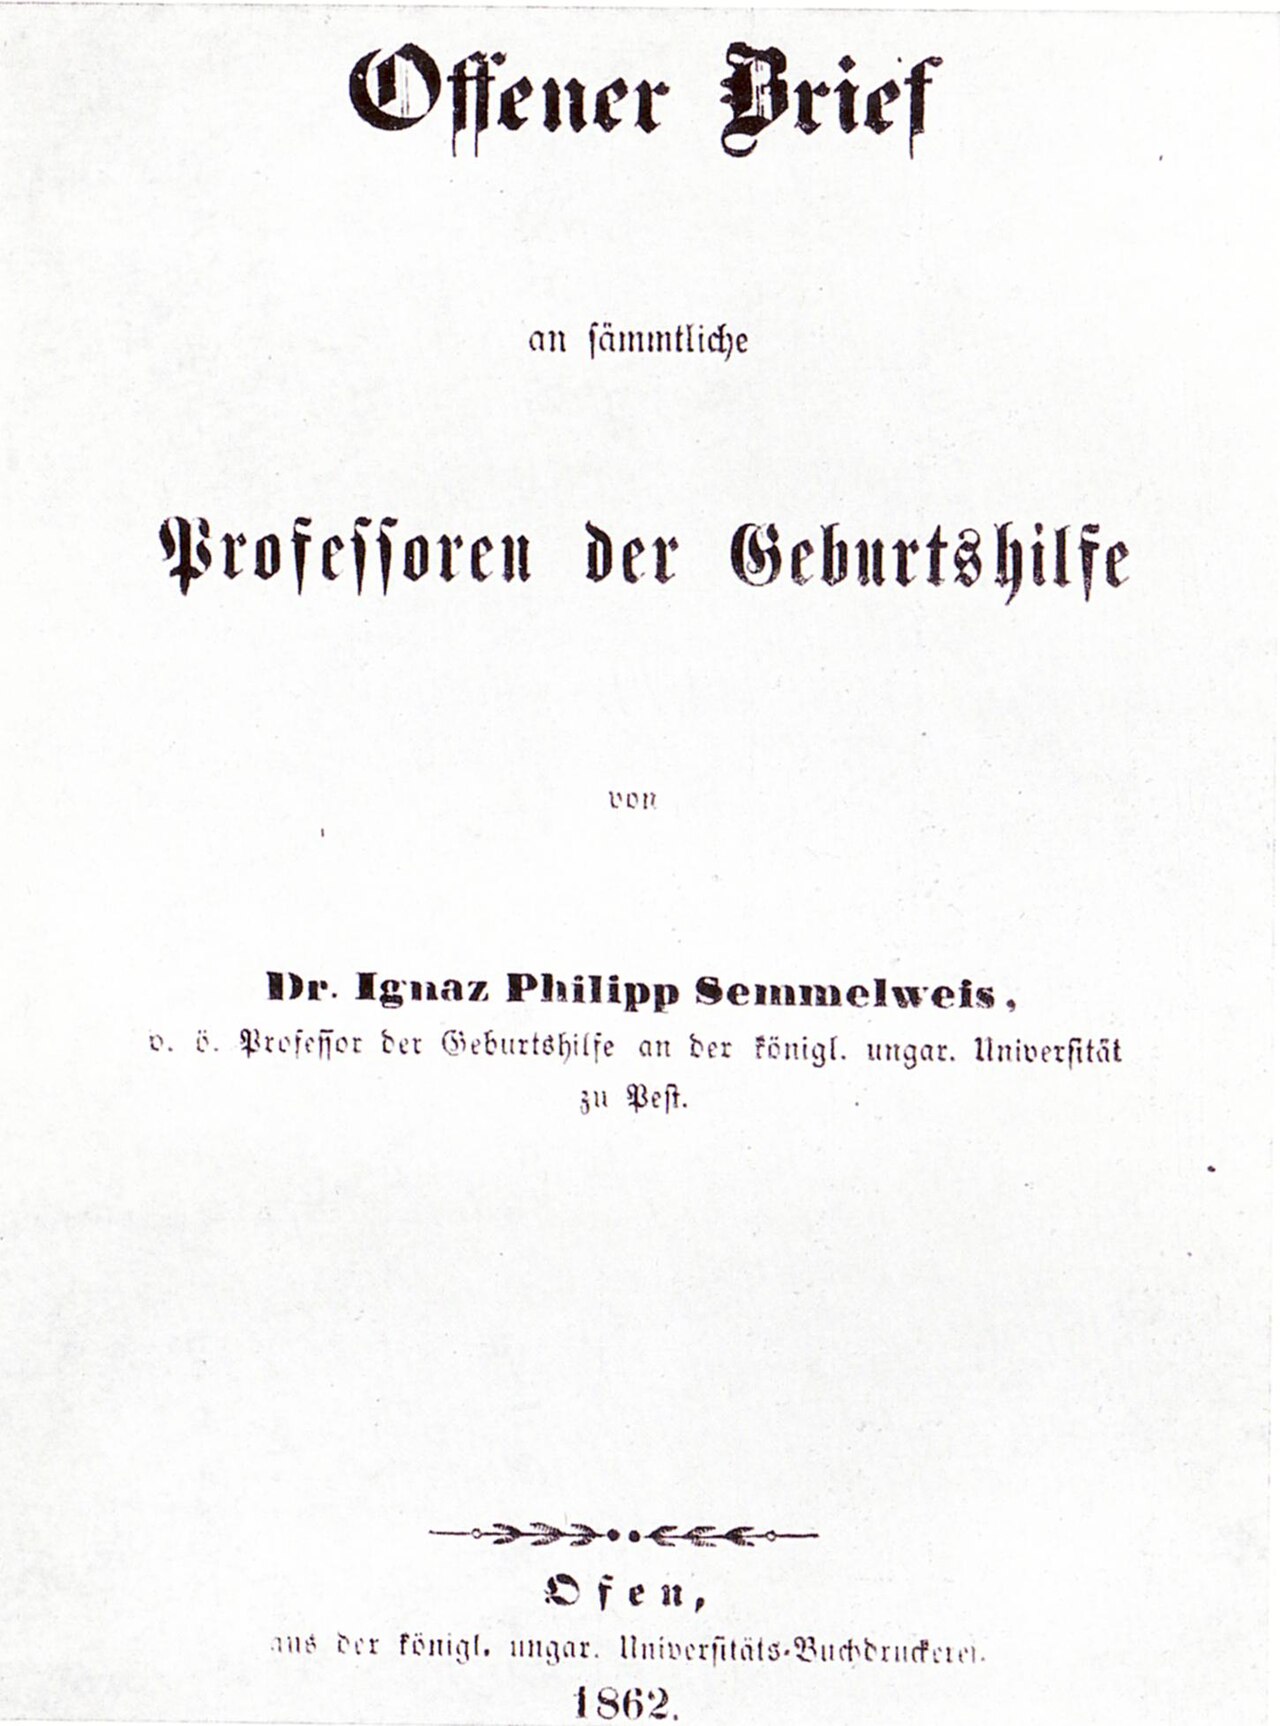 Letter
Primary source
Open Letter to All Professors of Obstetrics
Ignaz Semmelweis · 1862
 Document
Primary source
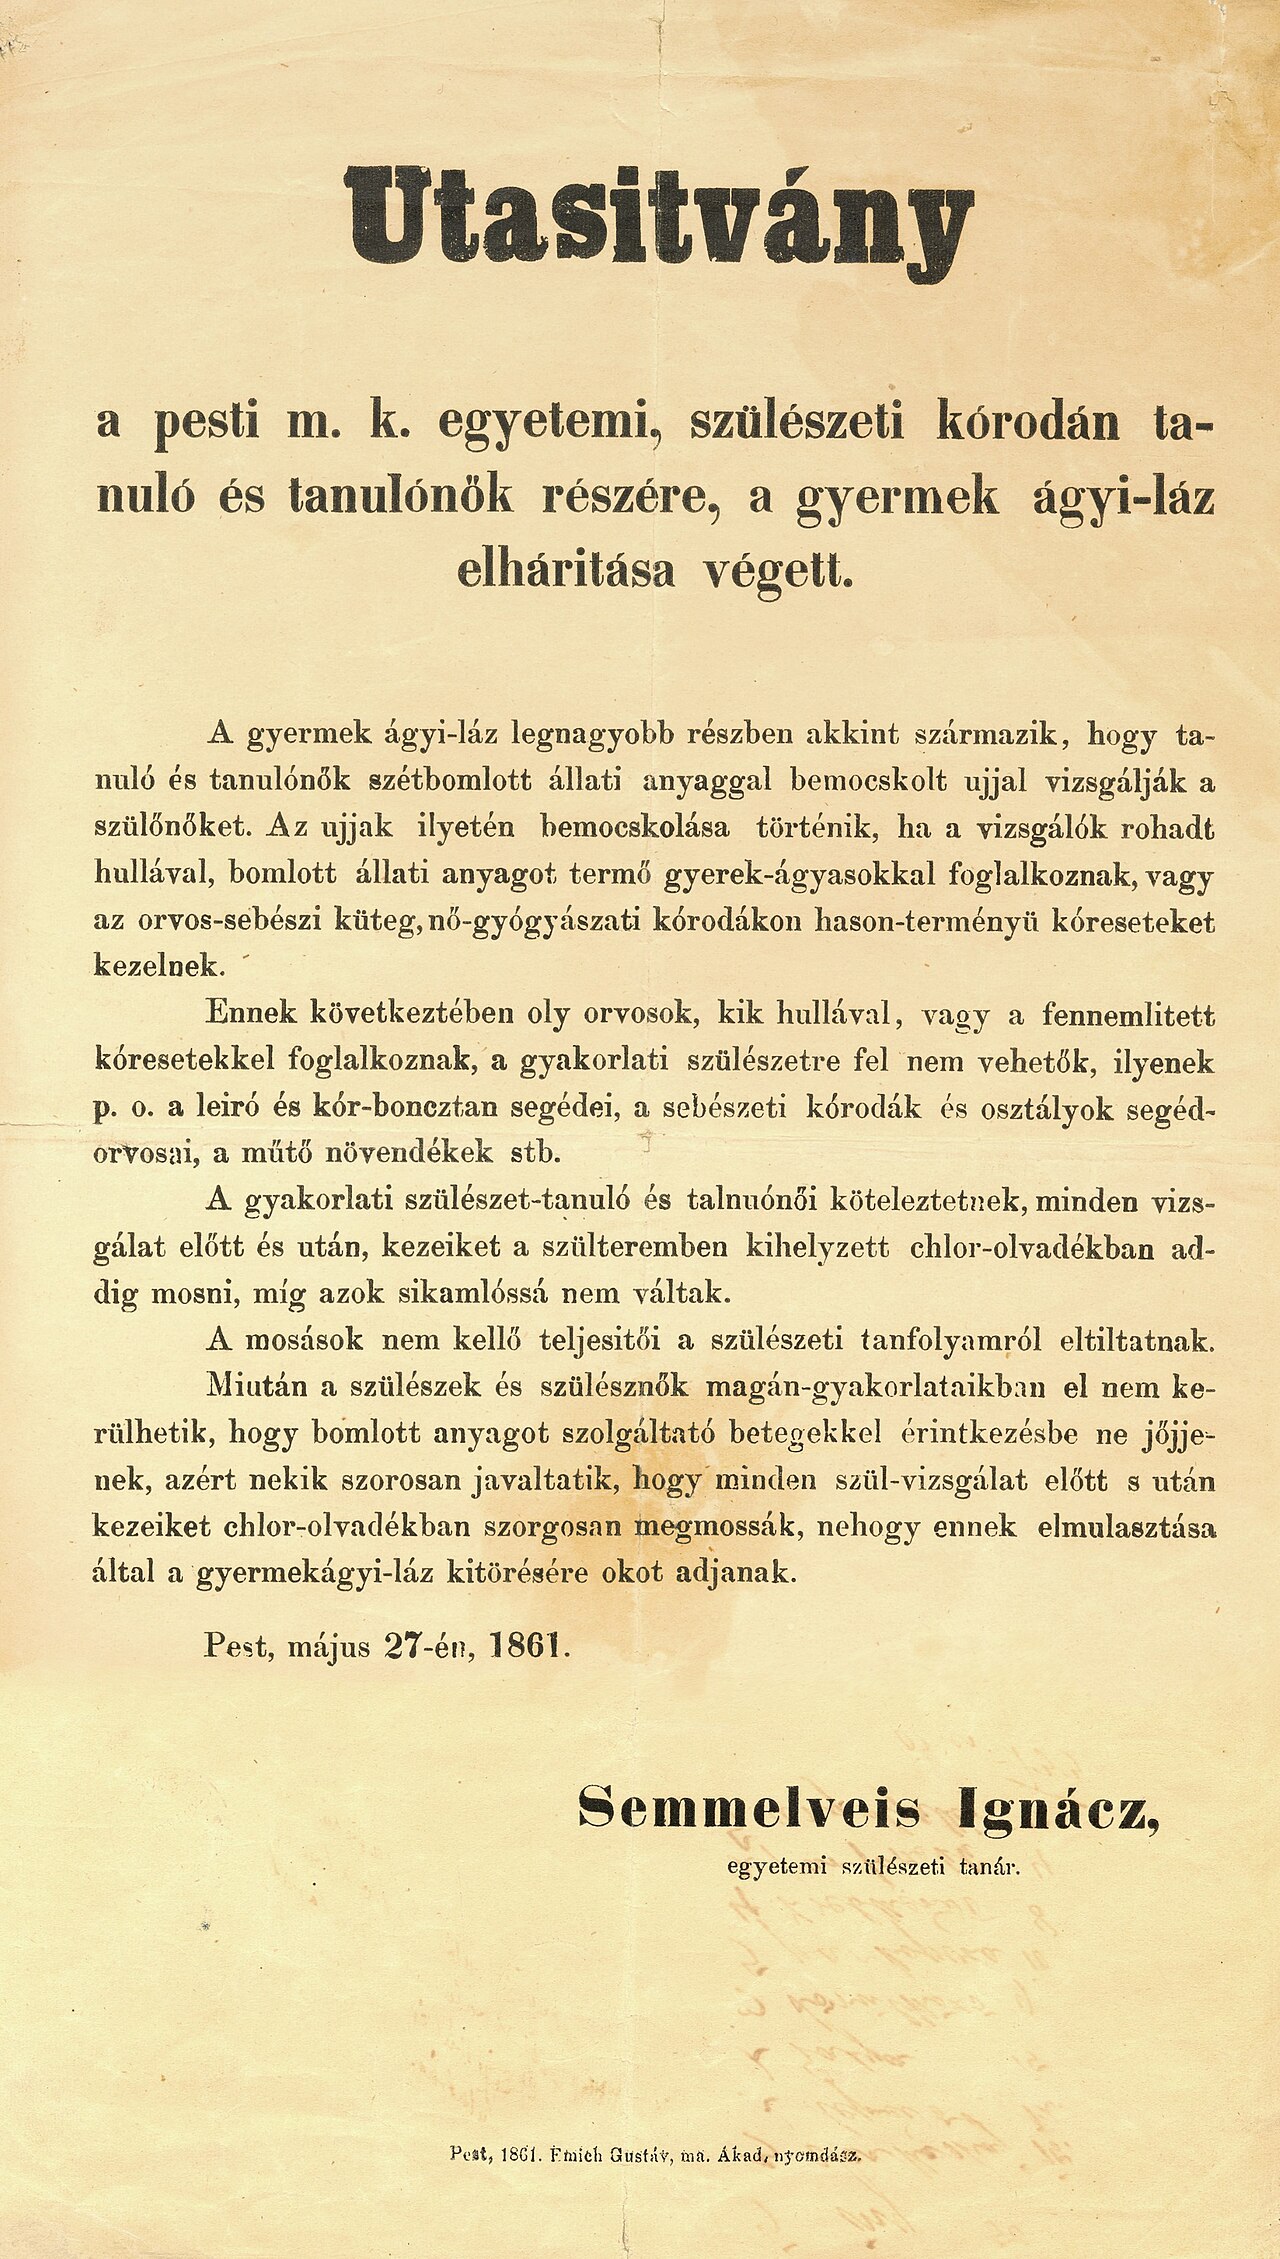
Instructions to Students at the Pest Obstetrics Clinic
Ignaz Semmelweis · 27 May 1861
 Photograph
Primary source
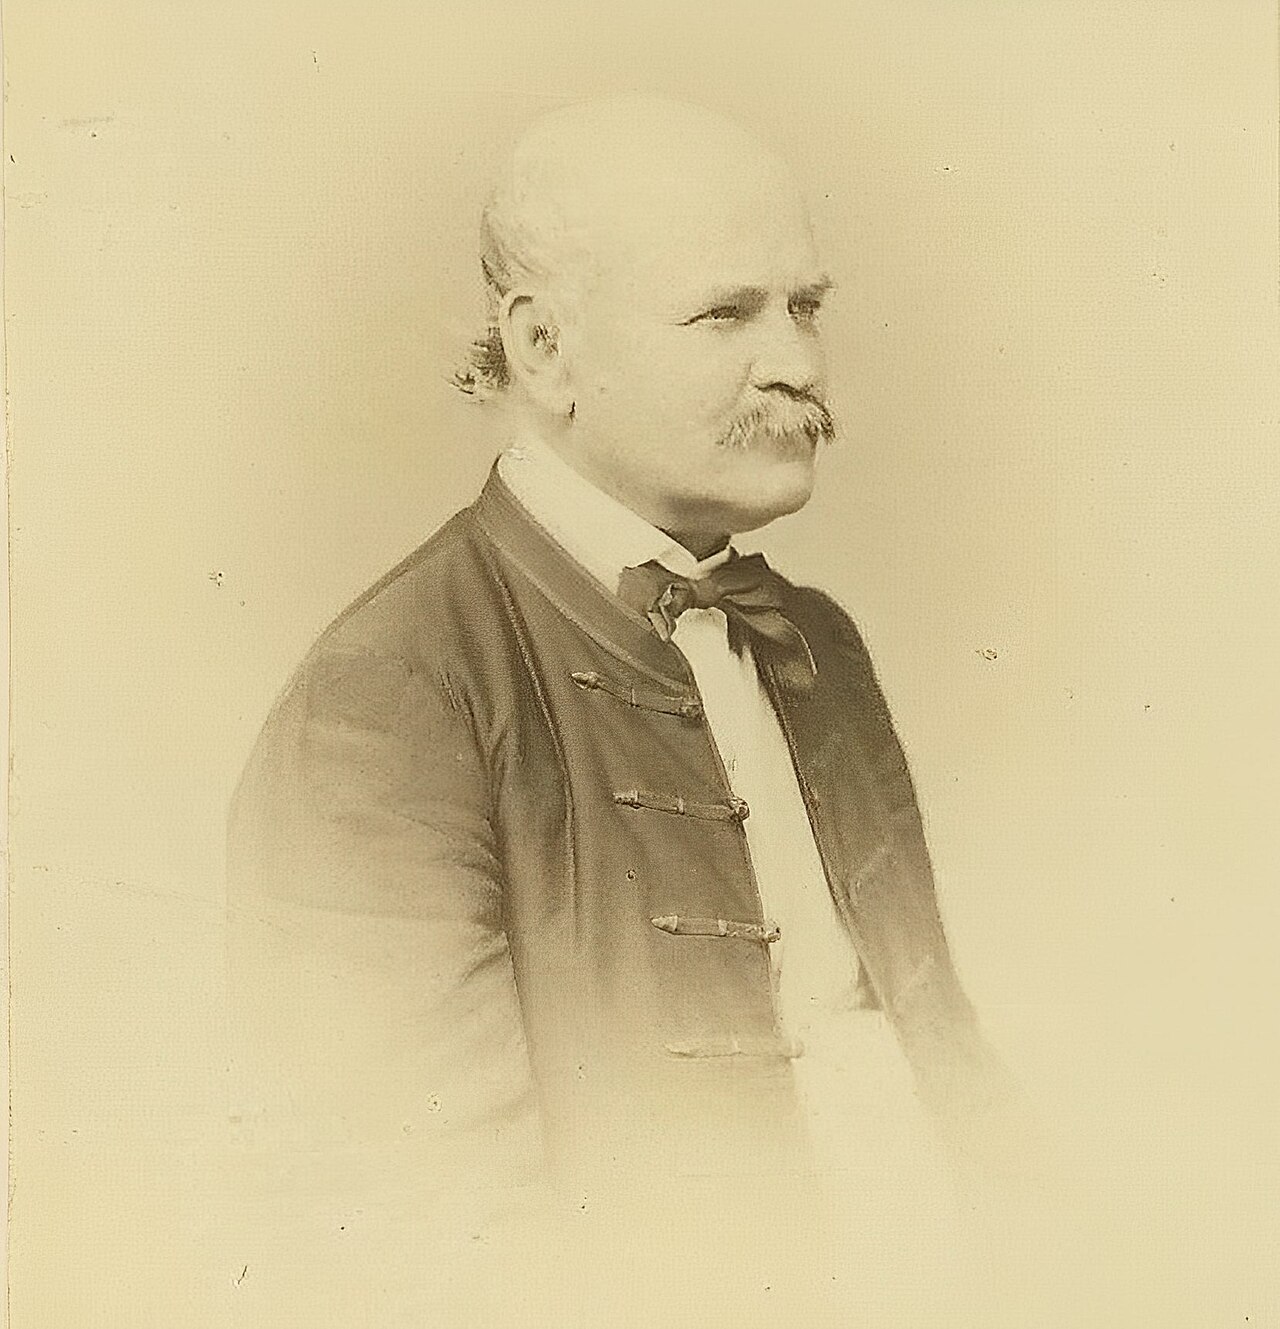
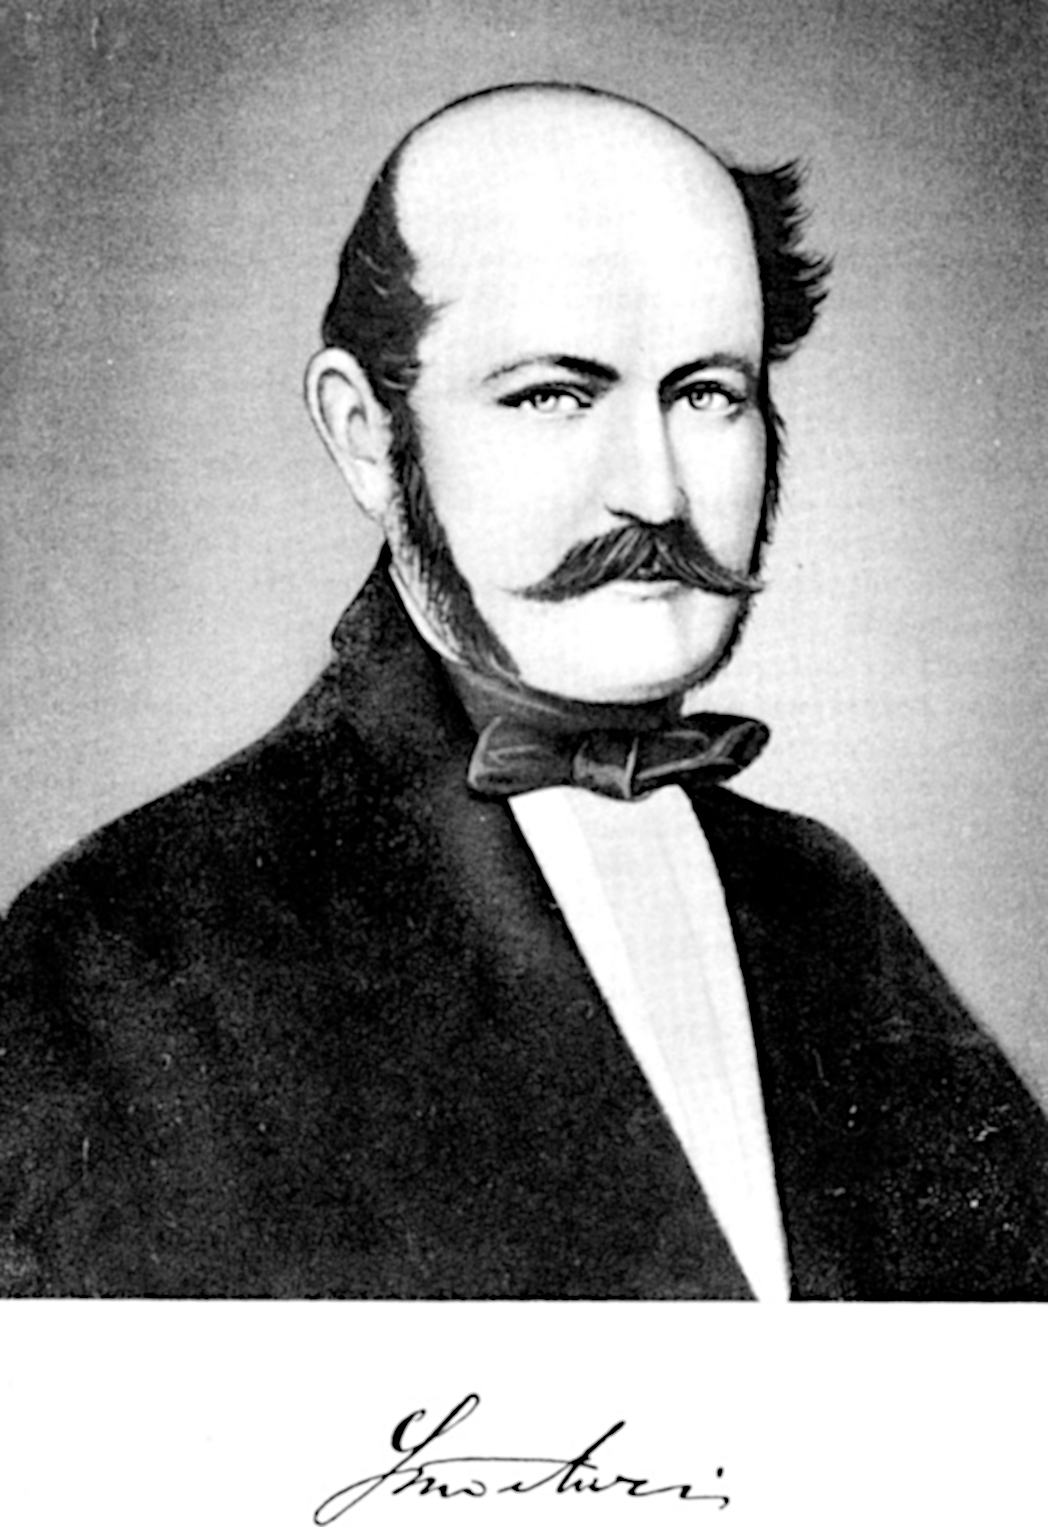
Portrait of Ignaz Semmelweis
Borsos & Doctor · 1860
 Letter
Primary source
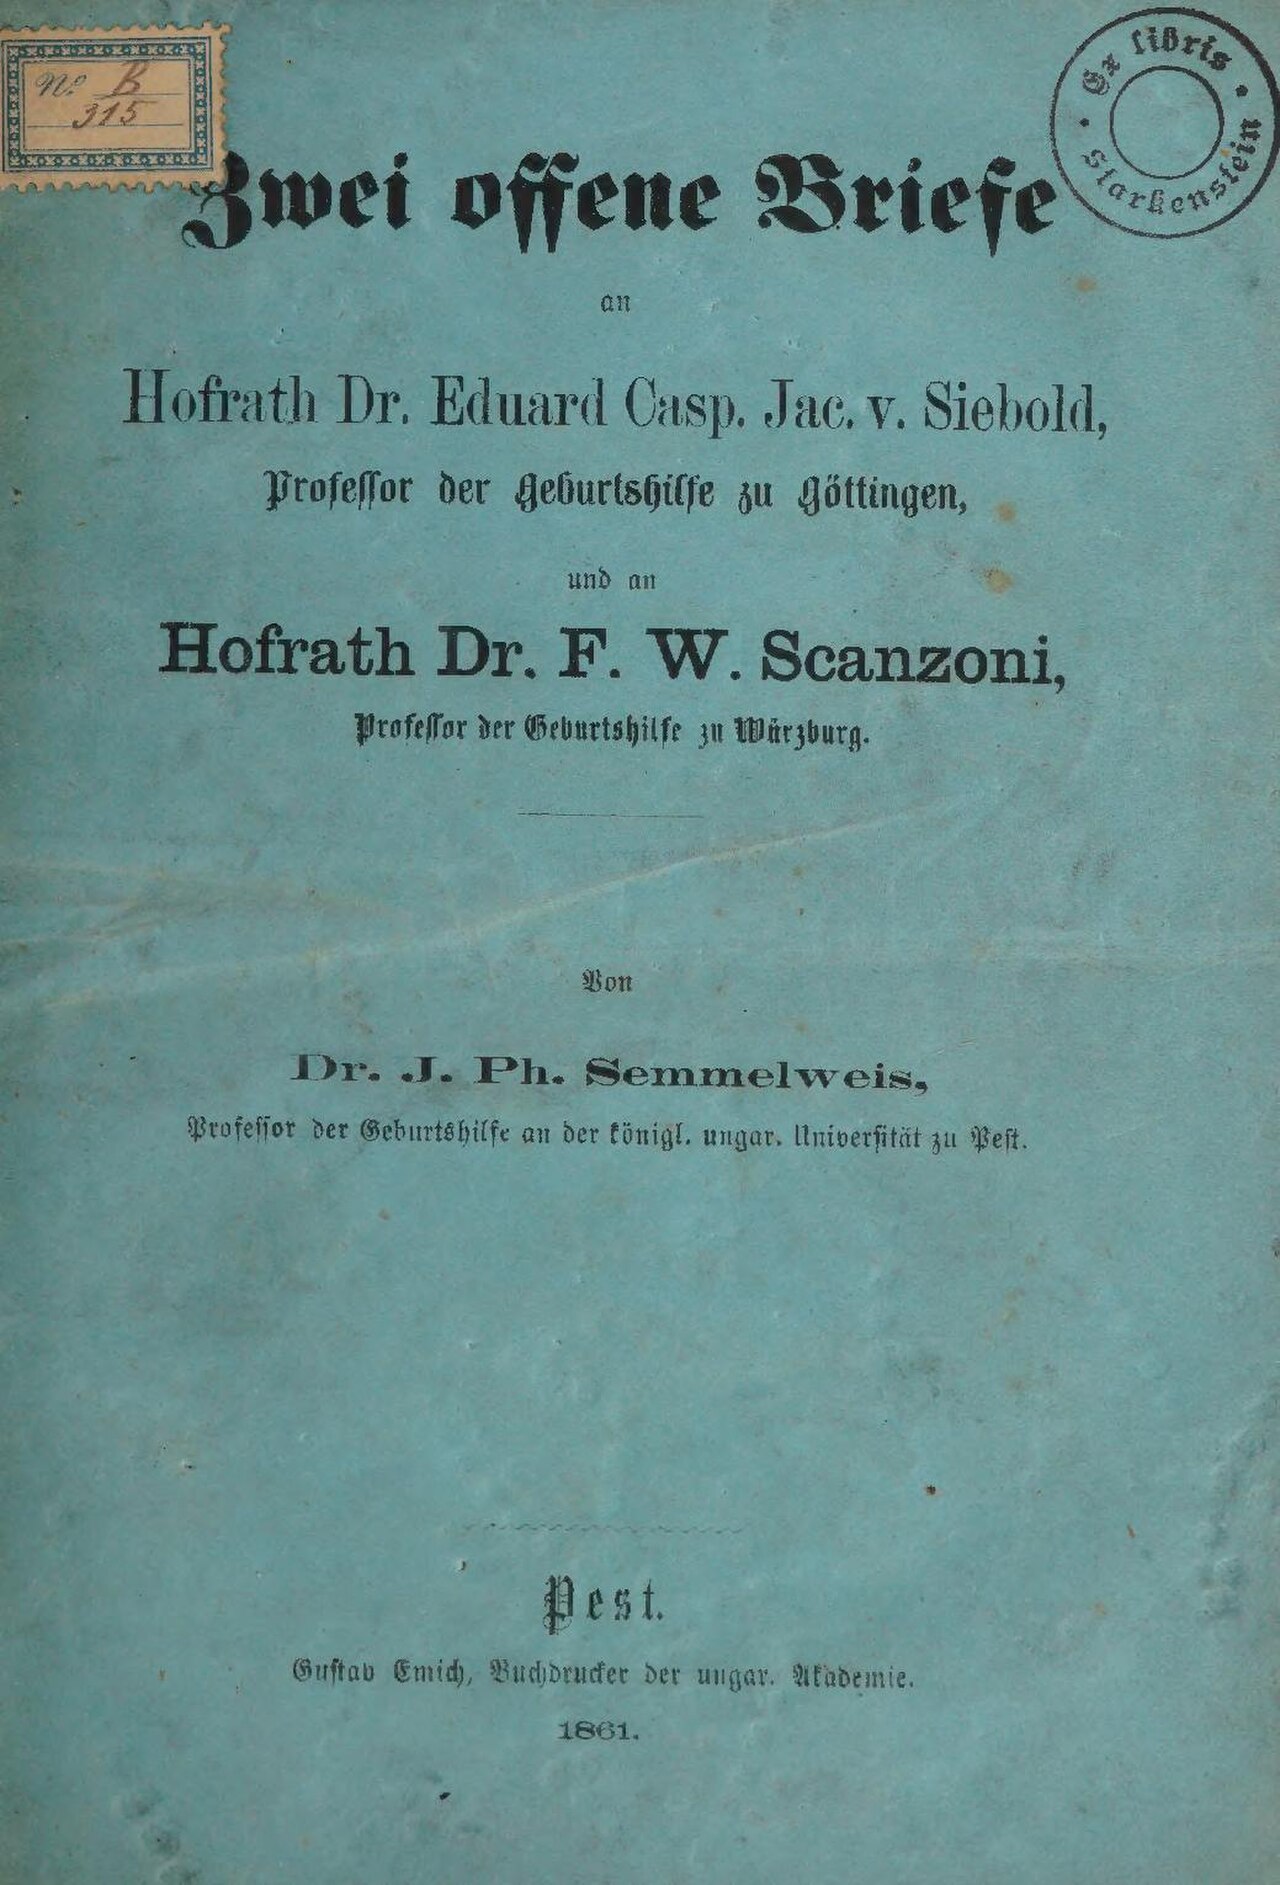
Two Open Letters to Siebold and Scanzoni
Ignaz Philipp Semmelweis · 1861
Free account
Read every Ignaz Semmelweis source
Sign up free →
Ready when you are
Start chatting with Ignaz Semmelweis now.
20 messages free · No credit card · Available in 50+ languages.