


Primary sourcePainting1730
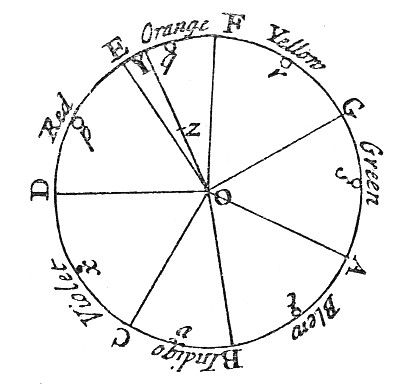
Newton's Colour Circle from Opticks
Isaac Newton · 1730
A hand-drawn diagram by Newton showing how colours of light relate to musical notes and mix together.
Drawn by Newton himself, this diagram shows his theory connecting the colours of light to musical proportions.
About this source
What it is
This is a colour circle drawn by Isaac Newton, published in his book Opticks in 1730. The circle is divided into seven labelled sectors — red, orange, yellow, green, blue, indigo and violet — with lines running from the centre to show how colours combine when mixed.
Why it matters
Newton compared the colours of the spectrum to musical notes, dividing the circle using the same proportions as a scale of music. This diagram shows how Newton connected his study of light to ideas from music, and demonstrates his method for predicting what colour would result from mixing other colours.
Look closer
- Why might Newton have chosen to compare colours to musical notes rather than describe them in another way?
- What does the centre of the circle represent, and why is it placed there?
- What does this diagram suggest about how Newton thought about light and colour as a kind of system?
This painting is part of the curated material that grounds the AI version of Isaac Newton on Humy.ai — when students ask about related events, the AI can quote it and cite it.
More Isaac Newton sources
Meet the AI Isaac Newton →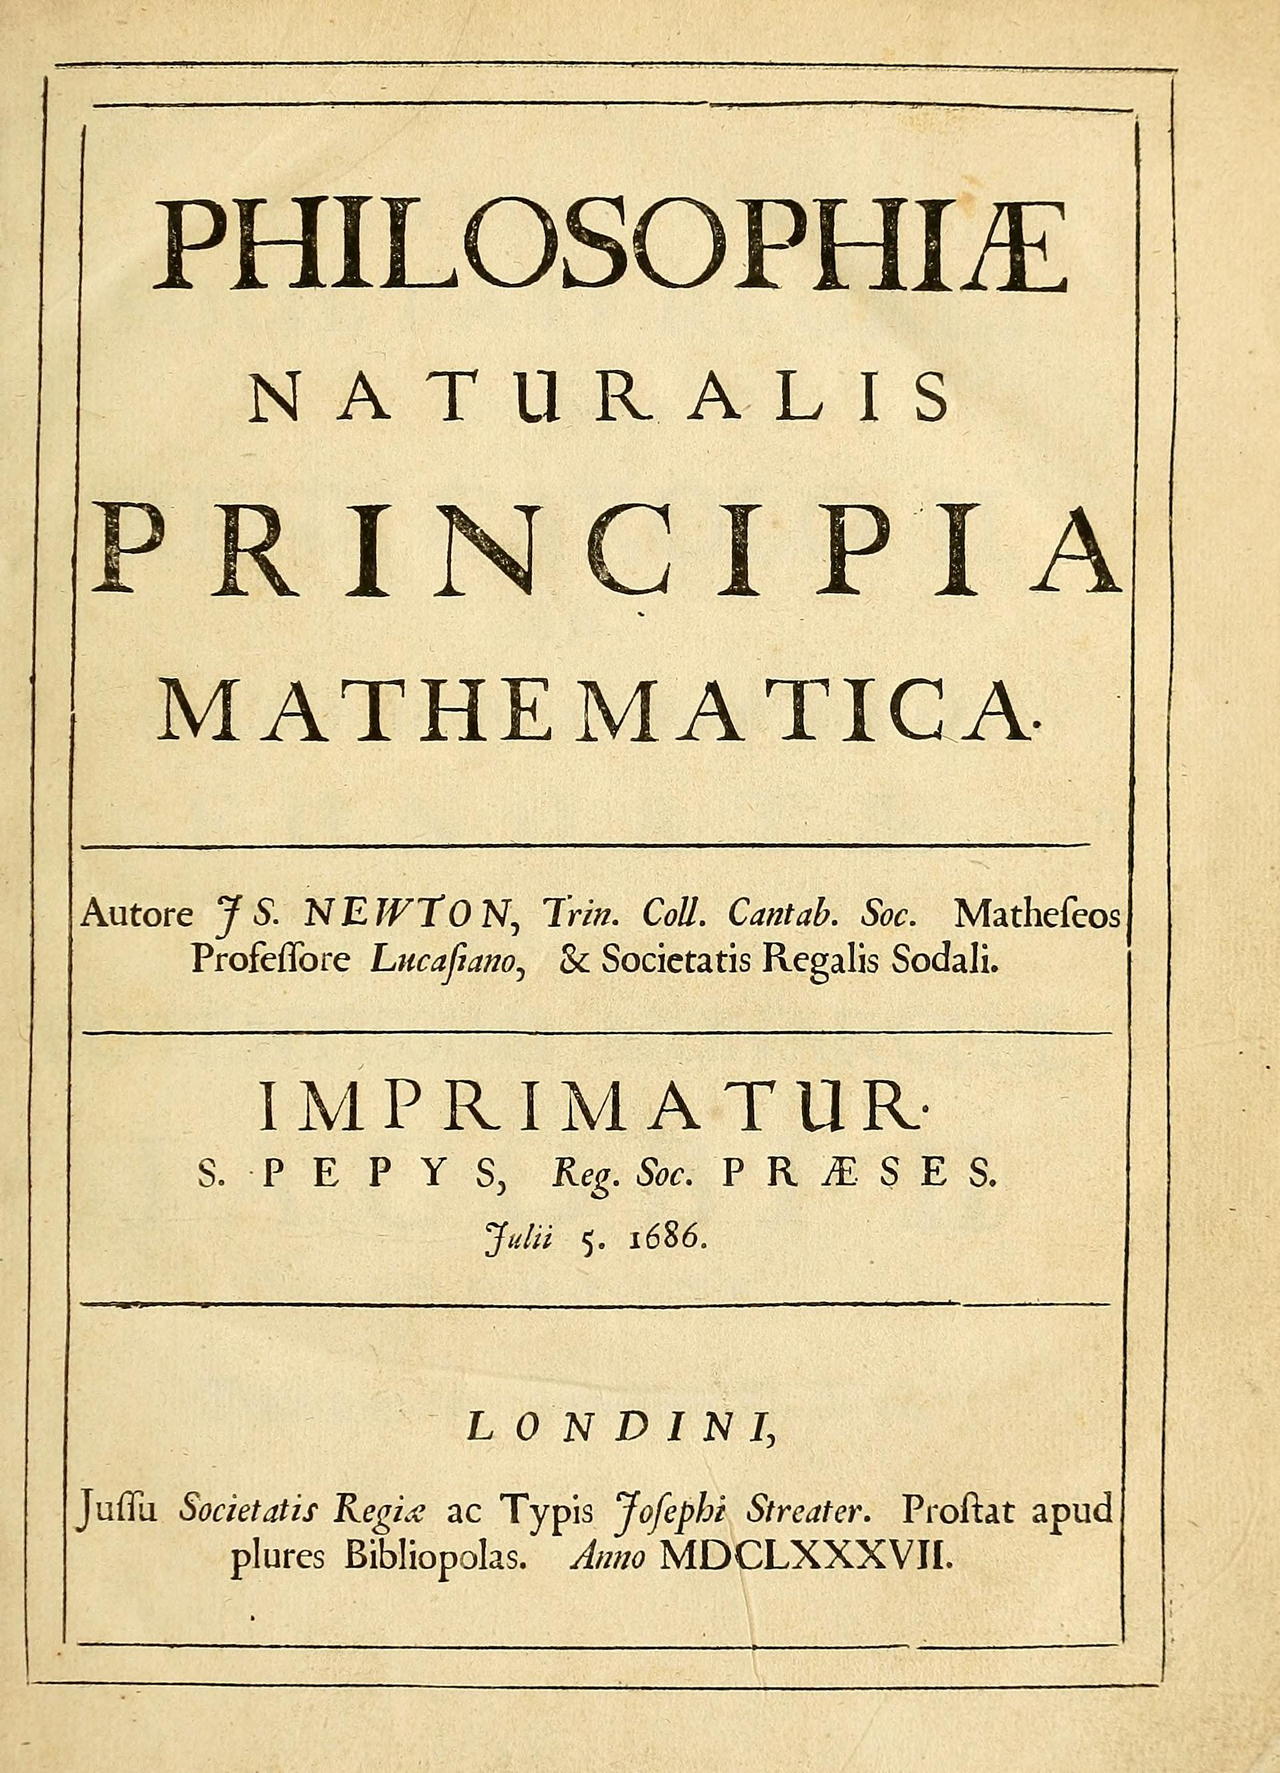 Book
Primary source
Philosophiæ Naturalis Principia Mathematica
Isaac Newton · 1687
 Book
Primary source
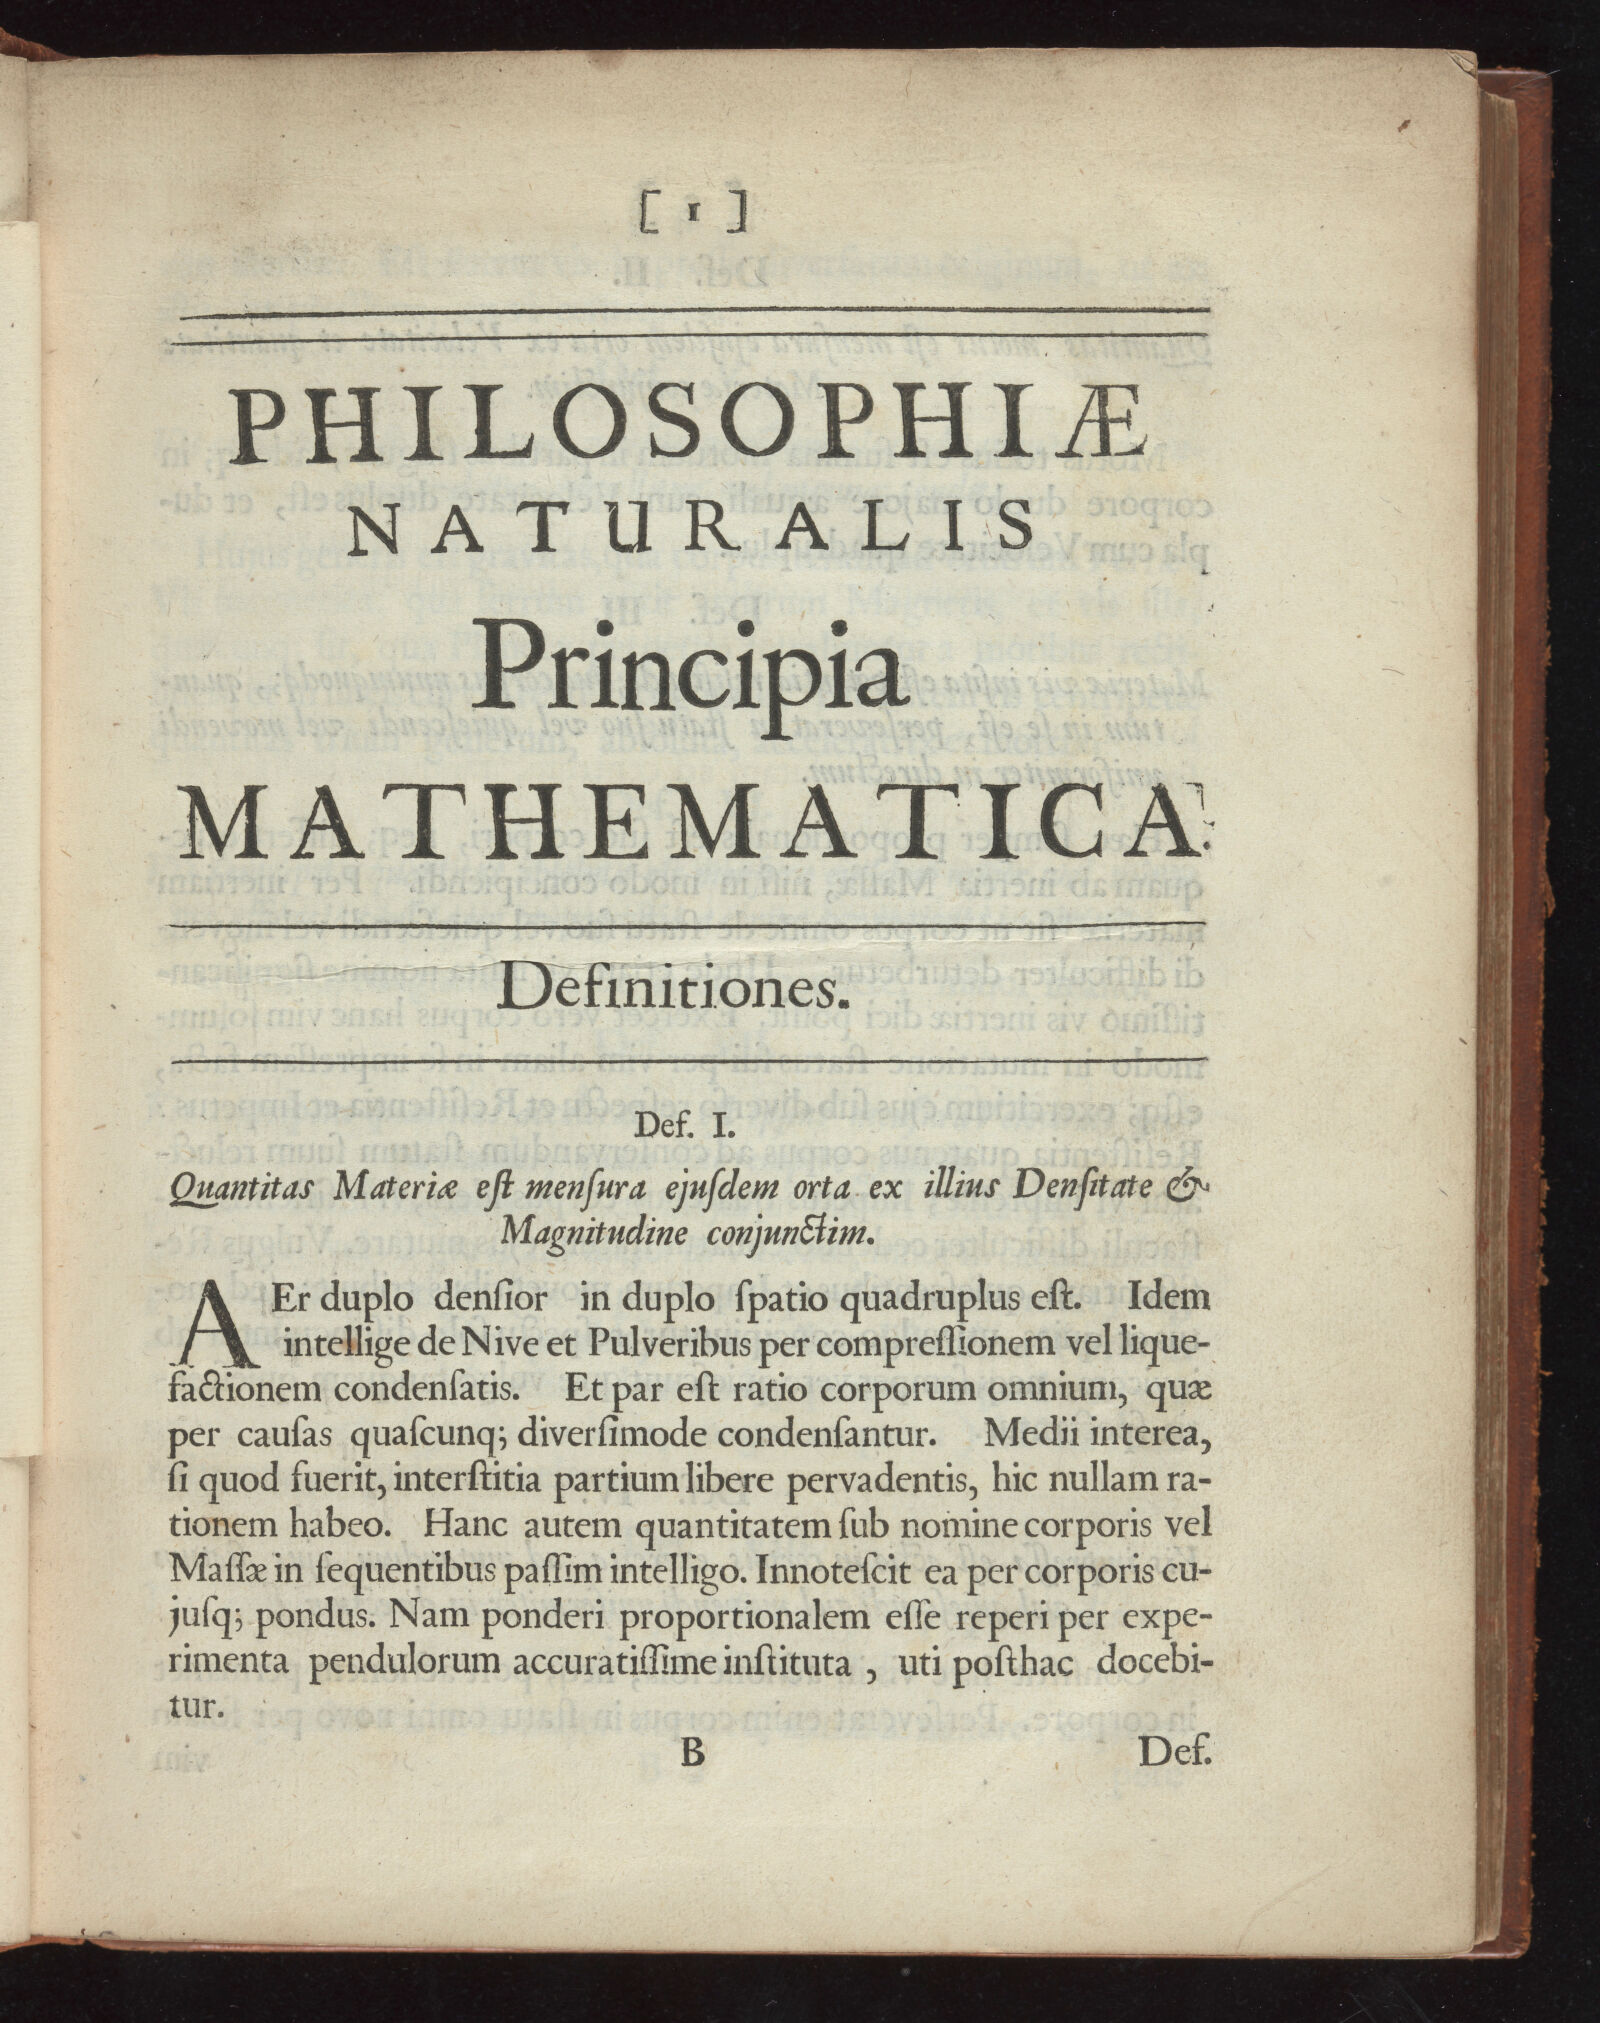
Principia Mathematica, Page 1: Definitions
Isaac Newton · 1687
 Painting
Primary source
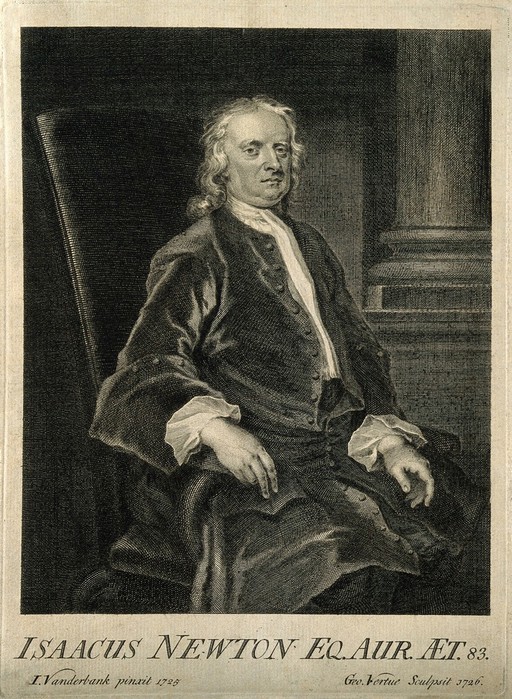
Sir Isaac Newton, line engraving by Vertue, 1726
George Vertue · 1726
 Document
Primary source
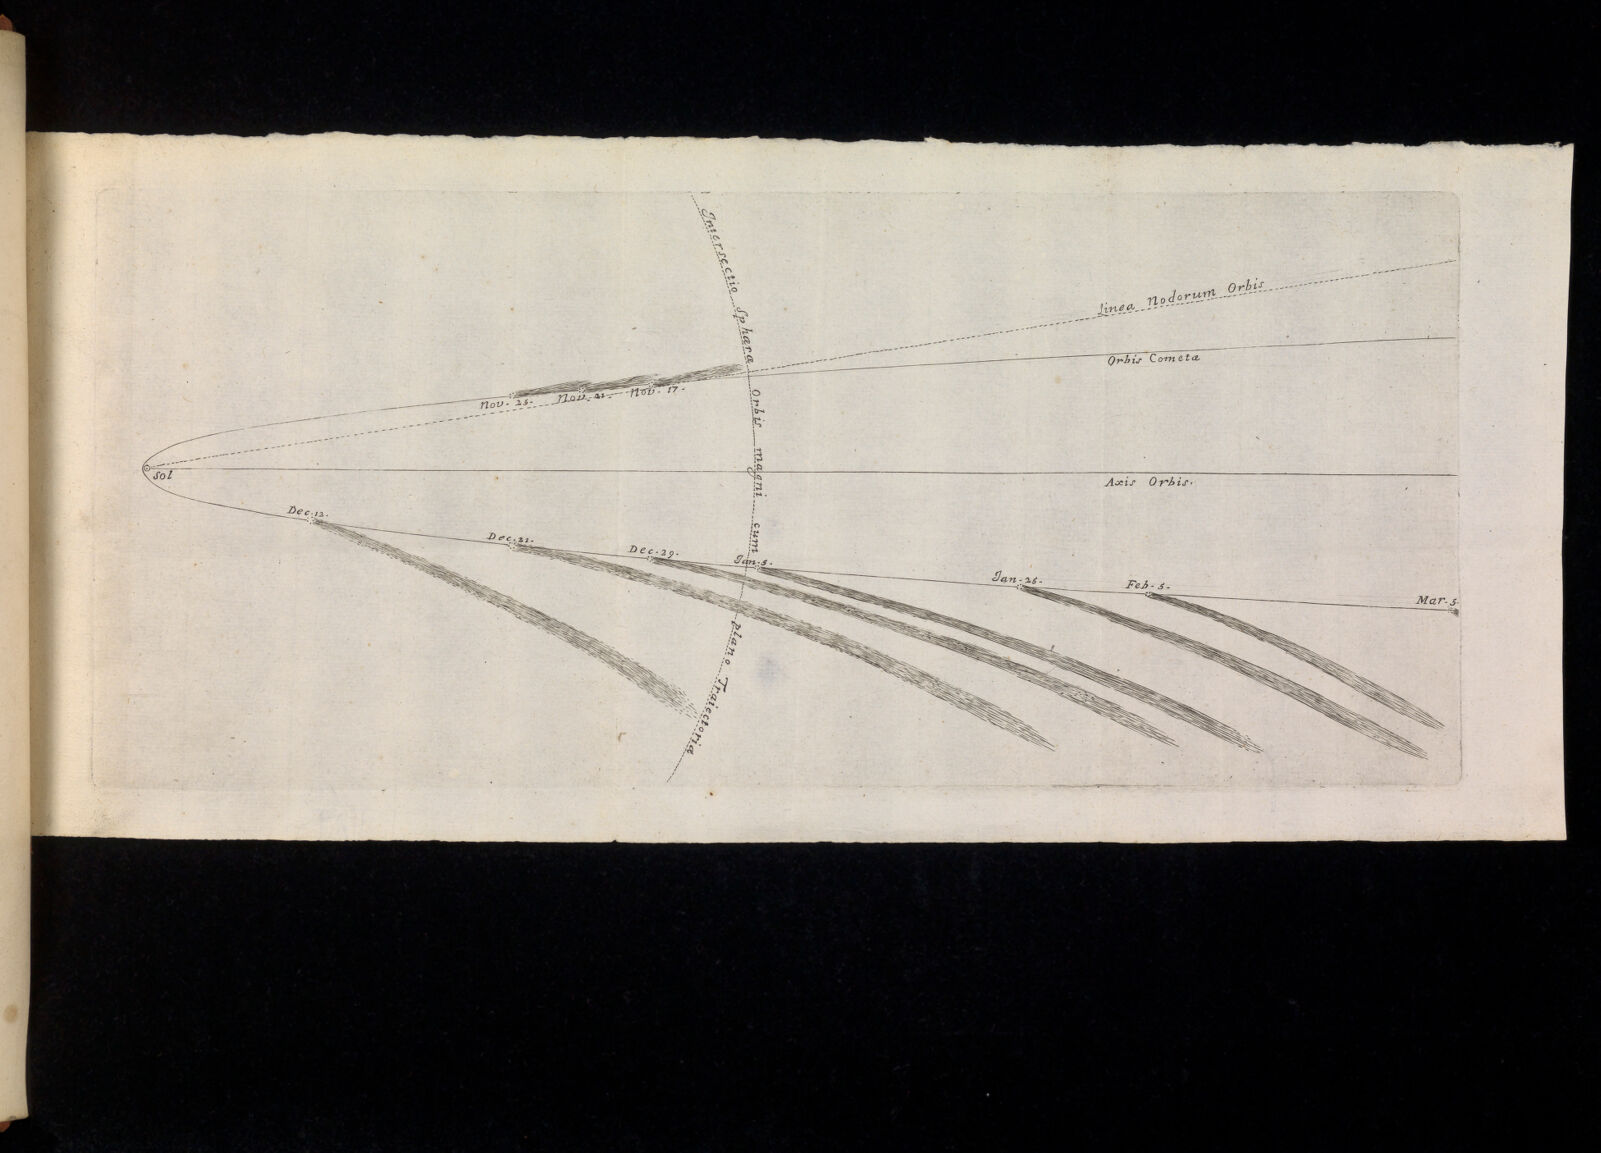
Principia Mathematica, Fold-out Diagram
Isaac Newton · 1687
 Painting
Primary source
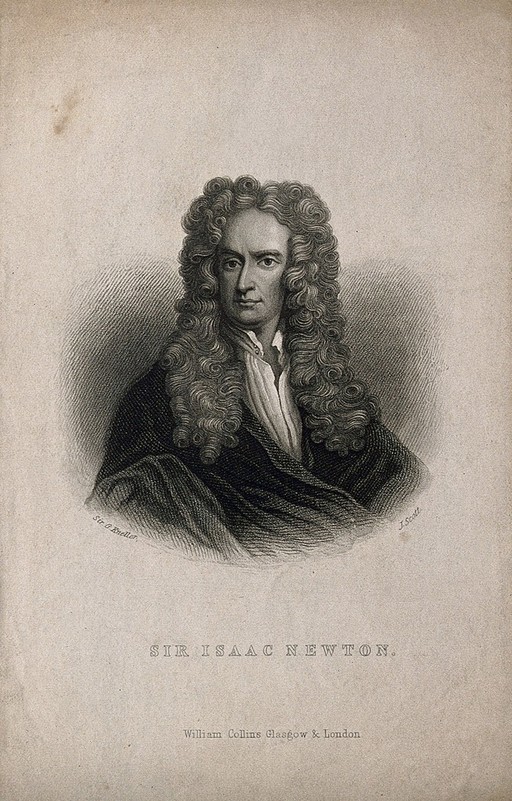
Sir Isaac Newton, stipple engraving by J. Scott after Kneller, 1702
J. Scott, after Sir Godfrey Kneller · 1702 (print made later)
Ready when you are
Start chatting with Isaac Newton now.
20 messages free · No credit card · Available in 50+ languages.