


Primary sourceArtifact1 October 1983
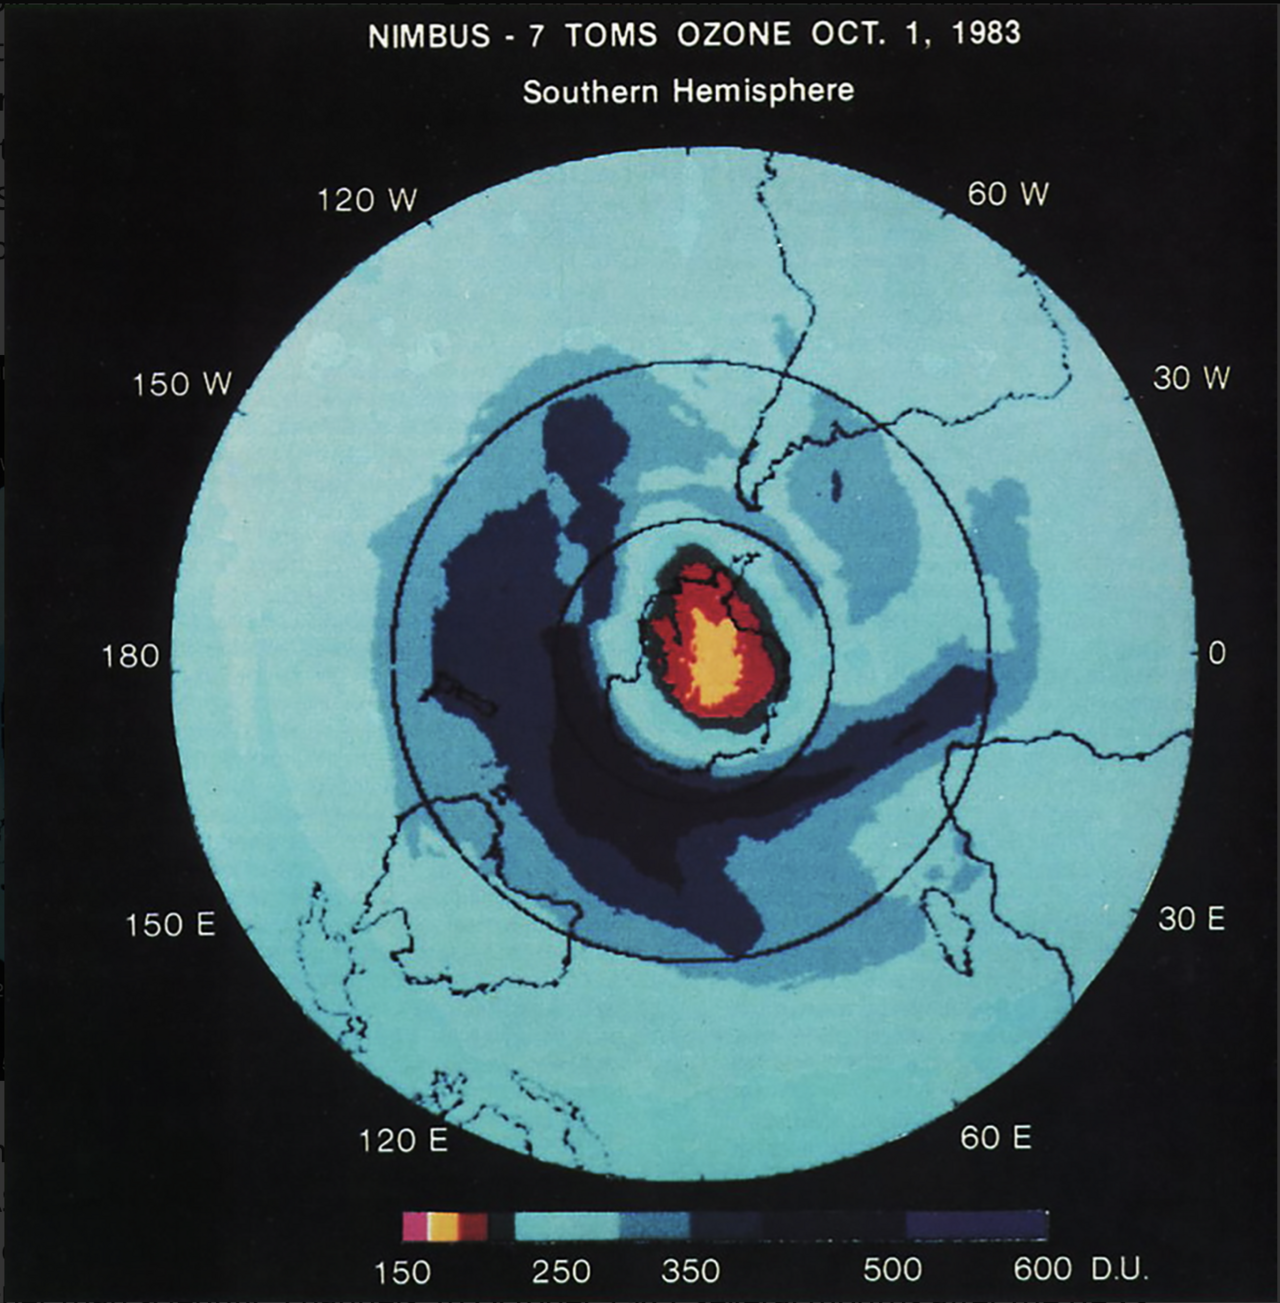
Satellite Map of Ozone over Antarctica, 1983
NASA · 1 October 1983
A 1983 NASA satellite map showing low ozone levels over Antarctica, visual evidence of the phenomenon Molina's research predicted.
A satellite record of the ozone depletion that Molina's research had predicted and explained.
About this source
What it is
This is a false-color satellite map made by NASA's Nimbus-7 satellite, using its Total Ozone Mapping Spectrometer instrument, showing total ozone levels over the Southern Hemisphere on 1 October 1983. Areas with the least ozone appear in red and yellow near the pole.
Why it matters
This kind of satellite data provided the observational record that confirmed what chemists like Mario Molina and F. Sherwood Rowland had predicted years earlier: that certain chemicals could thin the ozone layer. The map comes from the period when scientists were tracking the problem that led to the Montreal Protocol.
Look closer
- What does the color scale tell you about how scientists turn invisible gases into a picture people can understand?
- Why might a visual map like this have been more persuasive to the public and governments than written scientific reports?
- What is missing from this image that you would need to understand the cause of the pattern?
This artifact is part of the curated material that grounds the AI version of Mario Molina on Humy.ai — when students ask about related events, the AI can quote it and cite it.
More Mario Molina sources
Browse all 17 →Primary source
Montreal Protocol
1987
Secondary source
Presidential Medal of Freedom Recipient: Mario Molina
The White House · 2013
 Photograph
Primary source
Portrait of Mario Molina
2011
Secondary source
Proclamation 7220

Free account
Browse every Mario Molina source
Sign up free →
Ready when you are
Start chatting with Mario Molina now.
20 messages free · No credit card · Available in 50+ languages.