


Primary sourceArtifact1900
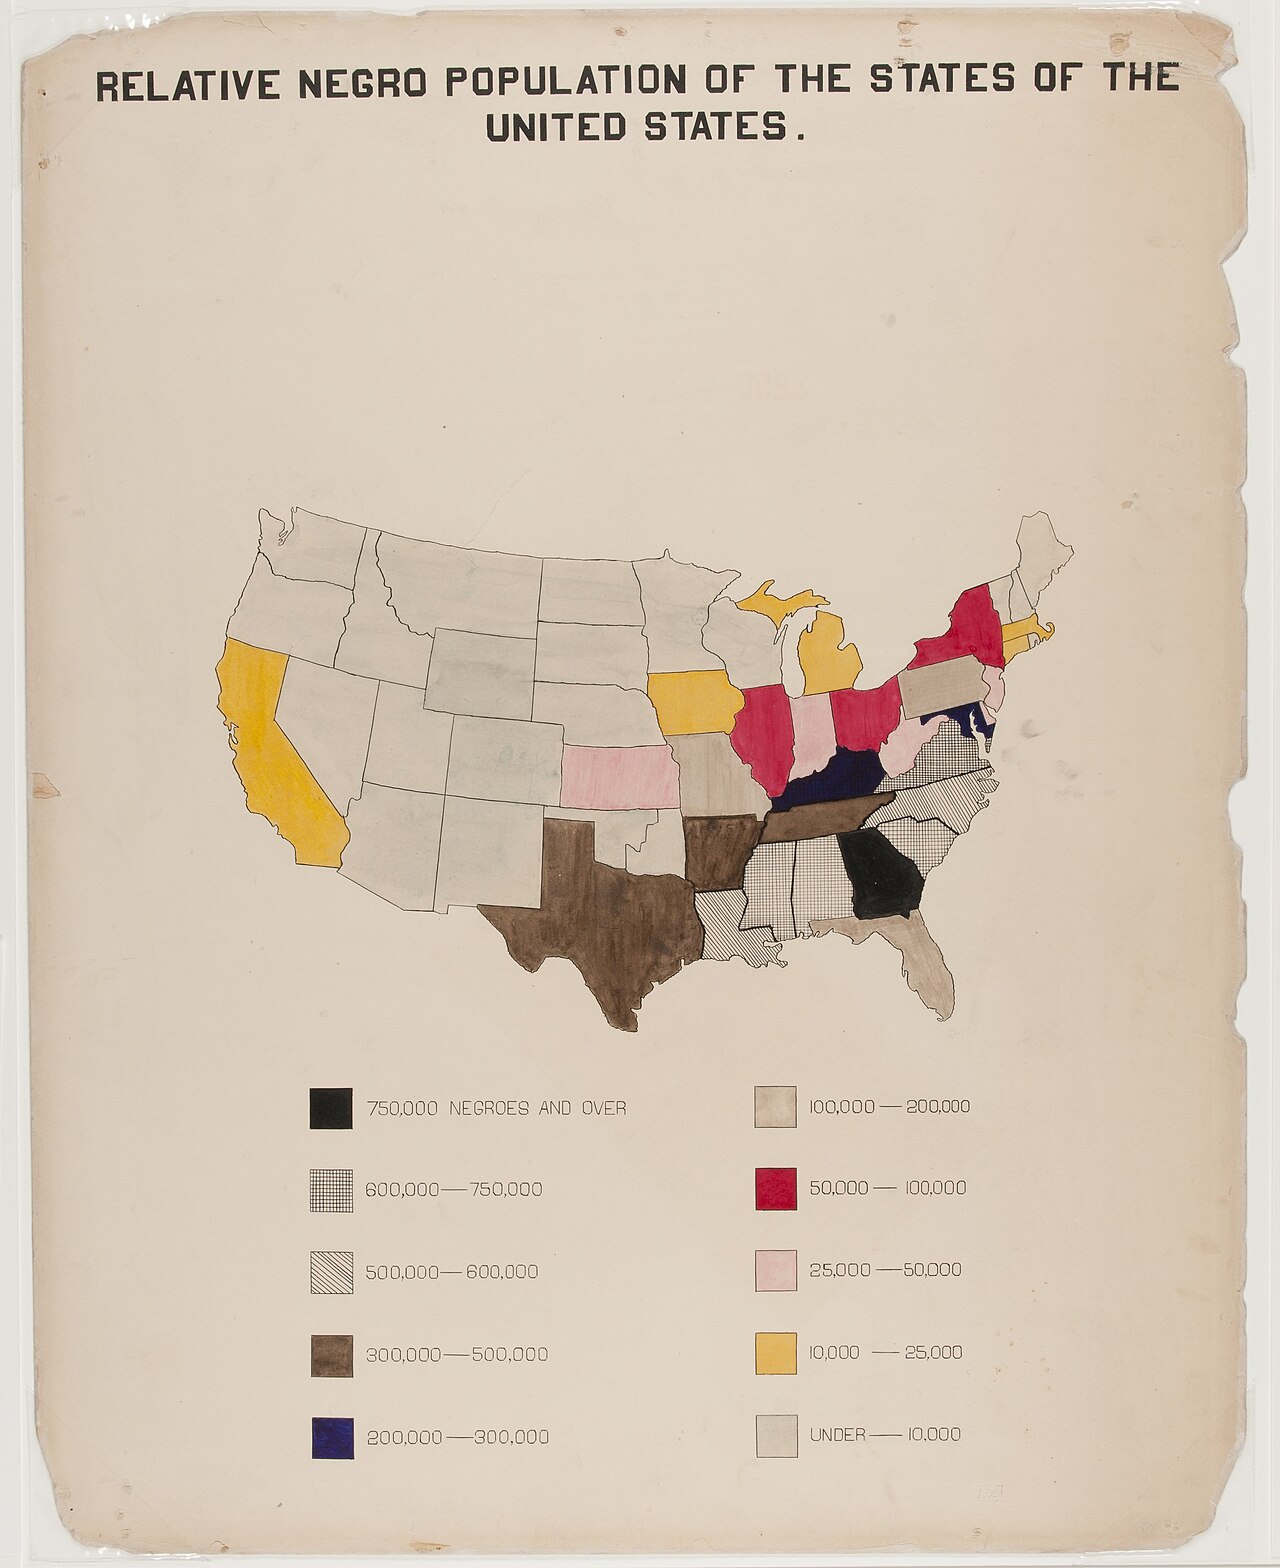
The Georgia Negro: map of African Americans by state
W. E. Burghardt Du Bois · 1900
A hand-colored map by Du Bois showing the Black population of each US state, made for the 1900 Paris Exposition.
Created by Du Bois to visualize Black population data for the 1900 Paris Exposition exhibit.
About this source
What it is
This ink and watercolor map was prepared by W. E. B. Du Bois for the Negro Exhibit of the American Section at the 1900 Paris Exposition. It uses colors to show the number of African Americans living in each US state.
Why it matters
This map was part of a set of visual data Du Bois created to demonstrate the social and economic progress of African Americans since emancipation to an international audience. It shows his early use of statistics and design to make arguments about race in America.
Look closer
- What does the color legend tell you about where African Americans lived in 1900?
- Why might Du Bois have wanted to present this information visually rather than in writing?
- What might this map leave out about the lives of the people it counts?
This artifact is part of the curated material that grounds the AI version of W.E.B. Du Bois on Humy.ai — when students ask about related events, the AI can quote it and cite it.
More W.E.B. Du Bois sources
Meet the AI W.E.B. Du Bois →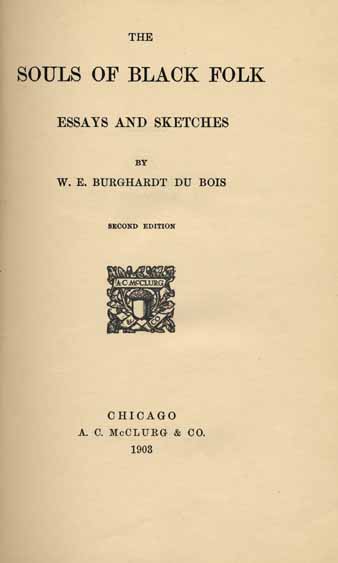 Book
Secondary source
The Souls of Black Folk
W. E. B. Du Bois · 18 April 1903
 Document
Primary source
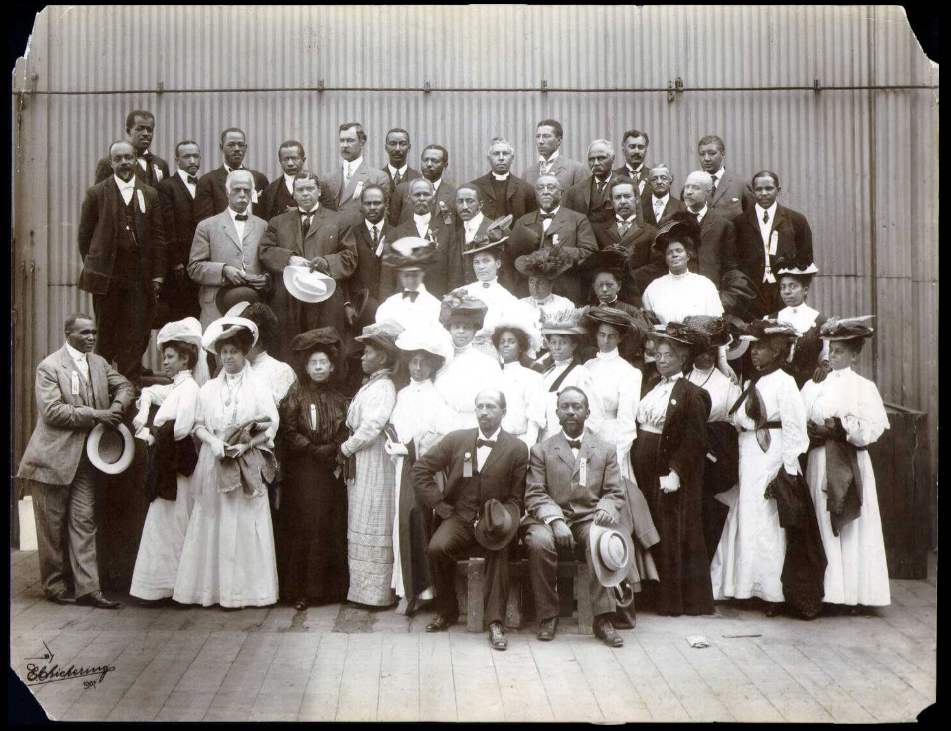
Niagara Movement
W. E. B. Du Bois · 1905
 Newspaper article
Primary source
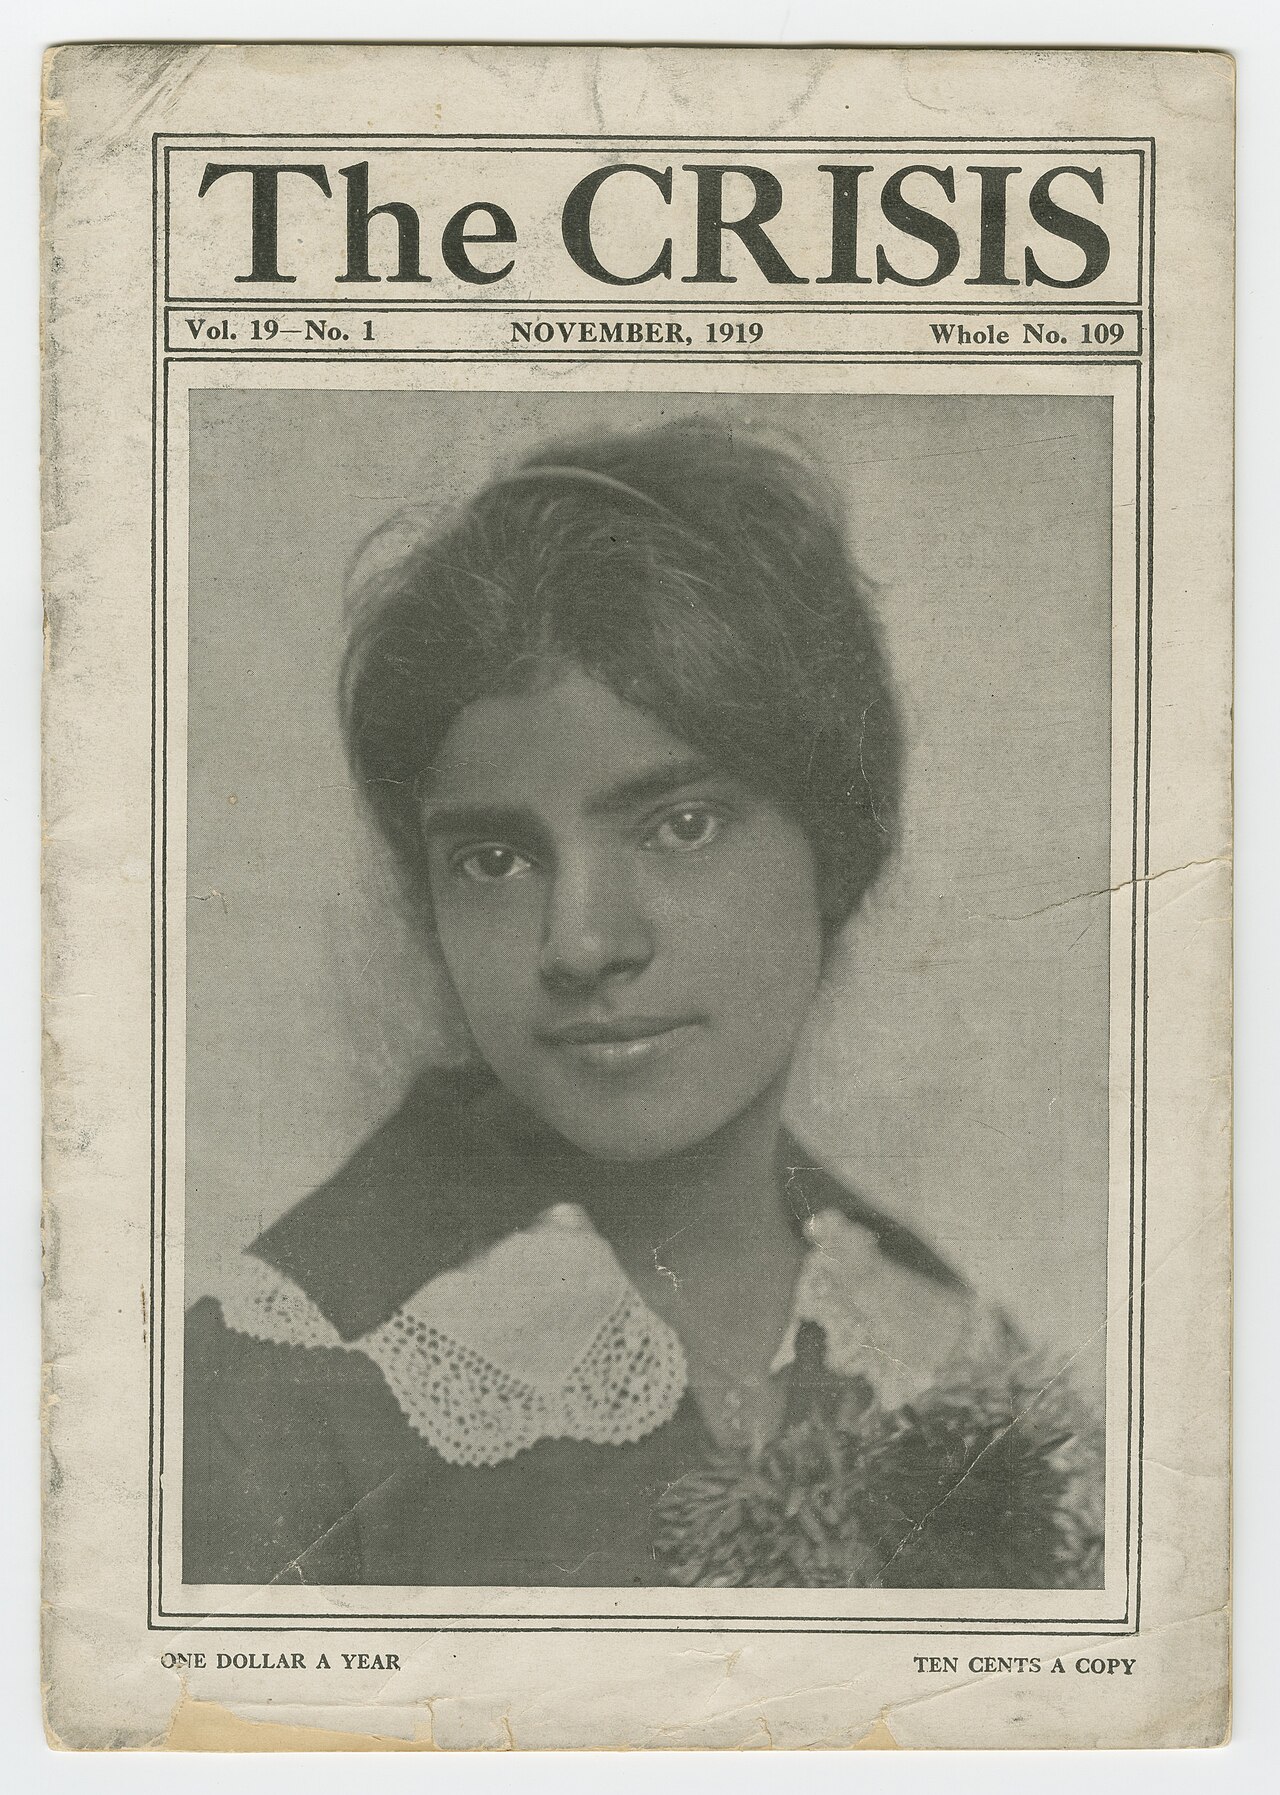
The Crisis
W. E. B. Du Bois · 1910
Primary source
The Talented Tenth
W. E. B. Du Bois · 1903
 Photograph
Primary source
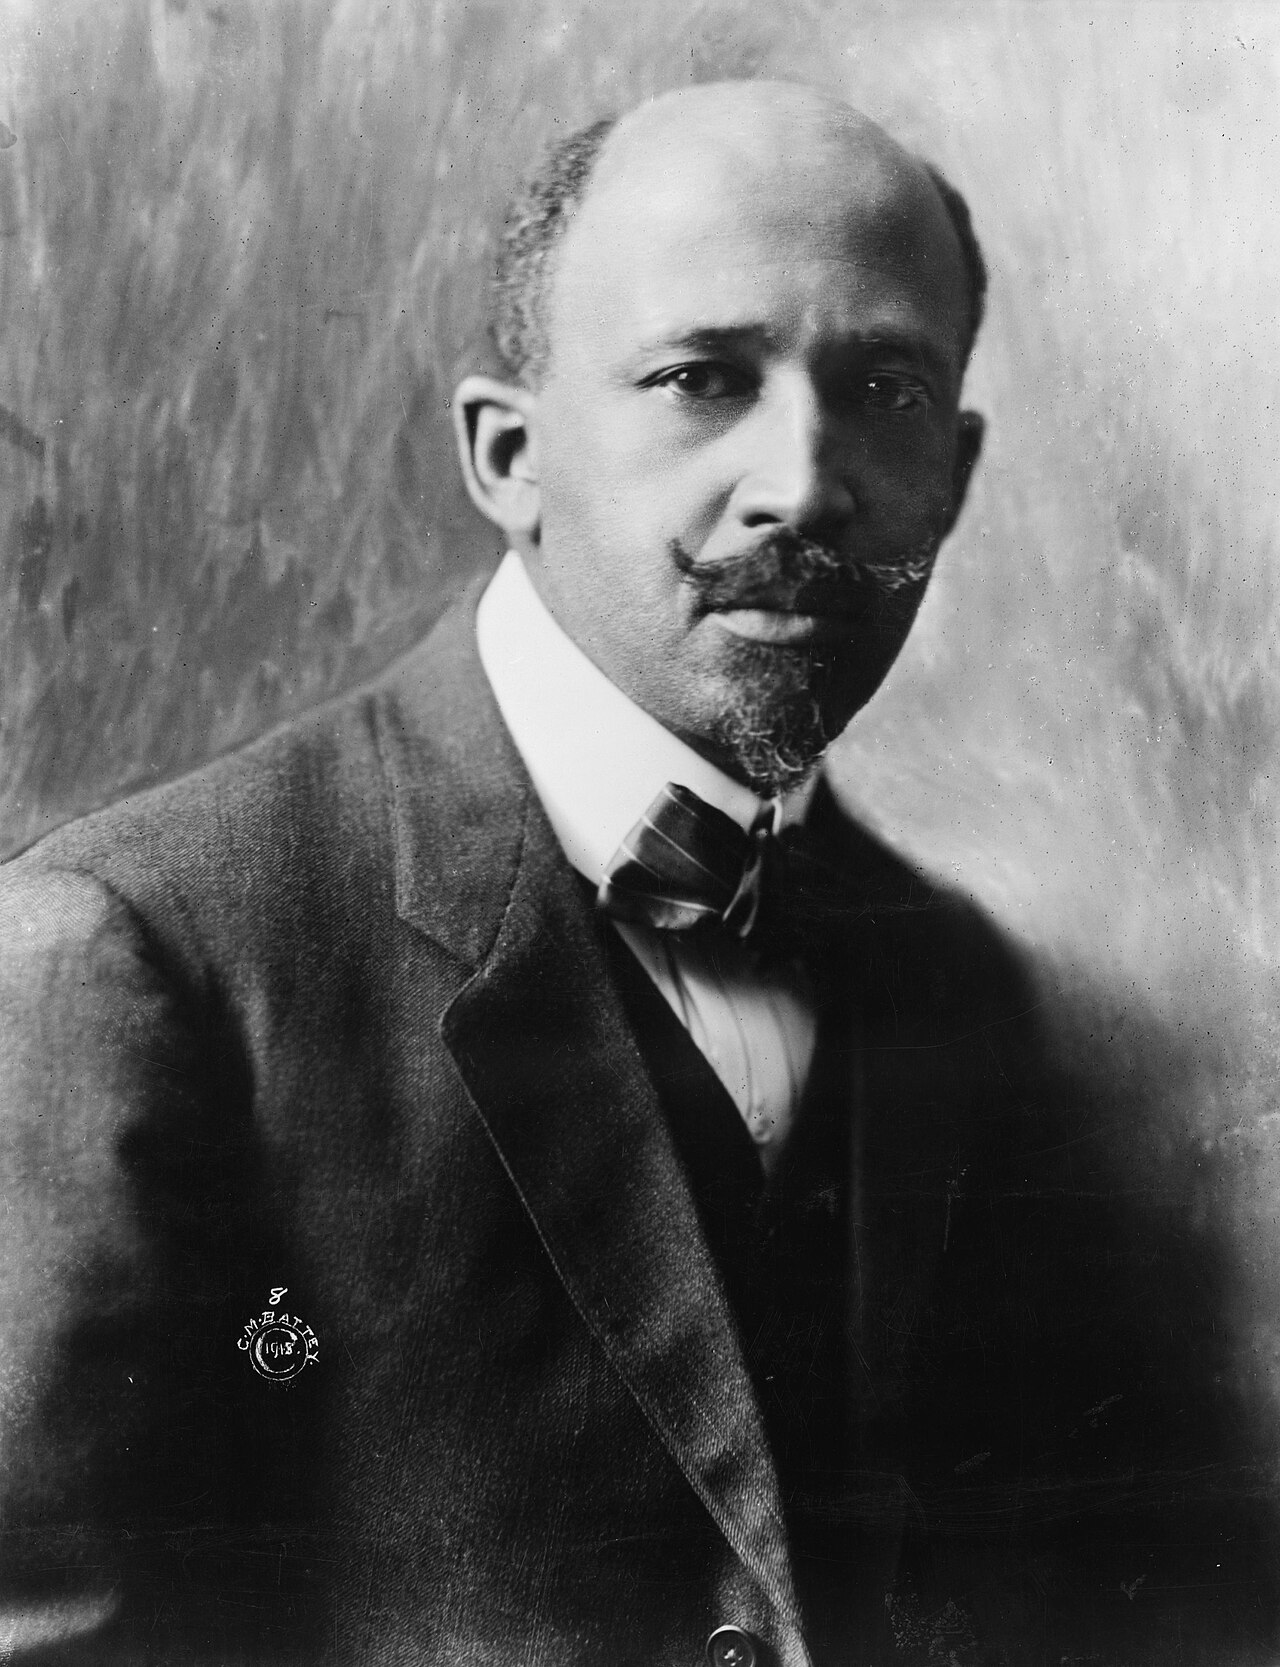
W. E. B. Du Bois, 1918 portrait
Cornelius Marion Battey · 1918
Ready when you are
Start chatting with W.E.B. Du Bois now.
20 messages free · No credit card · Available in 50+ languages.