


Primary sourceDocument1776
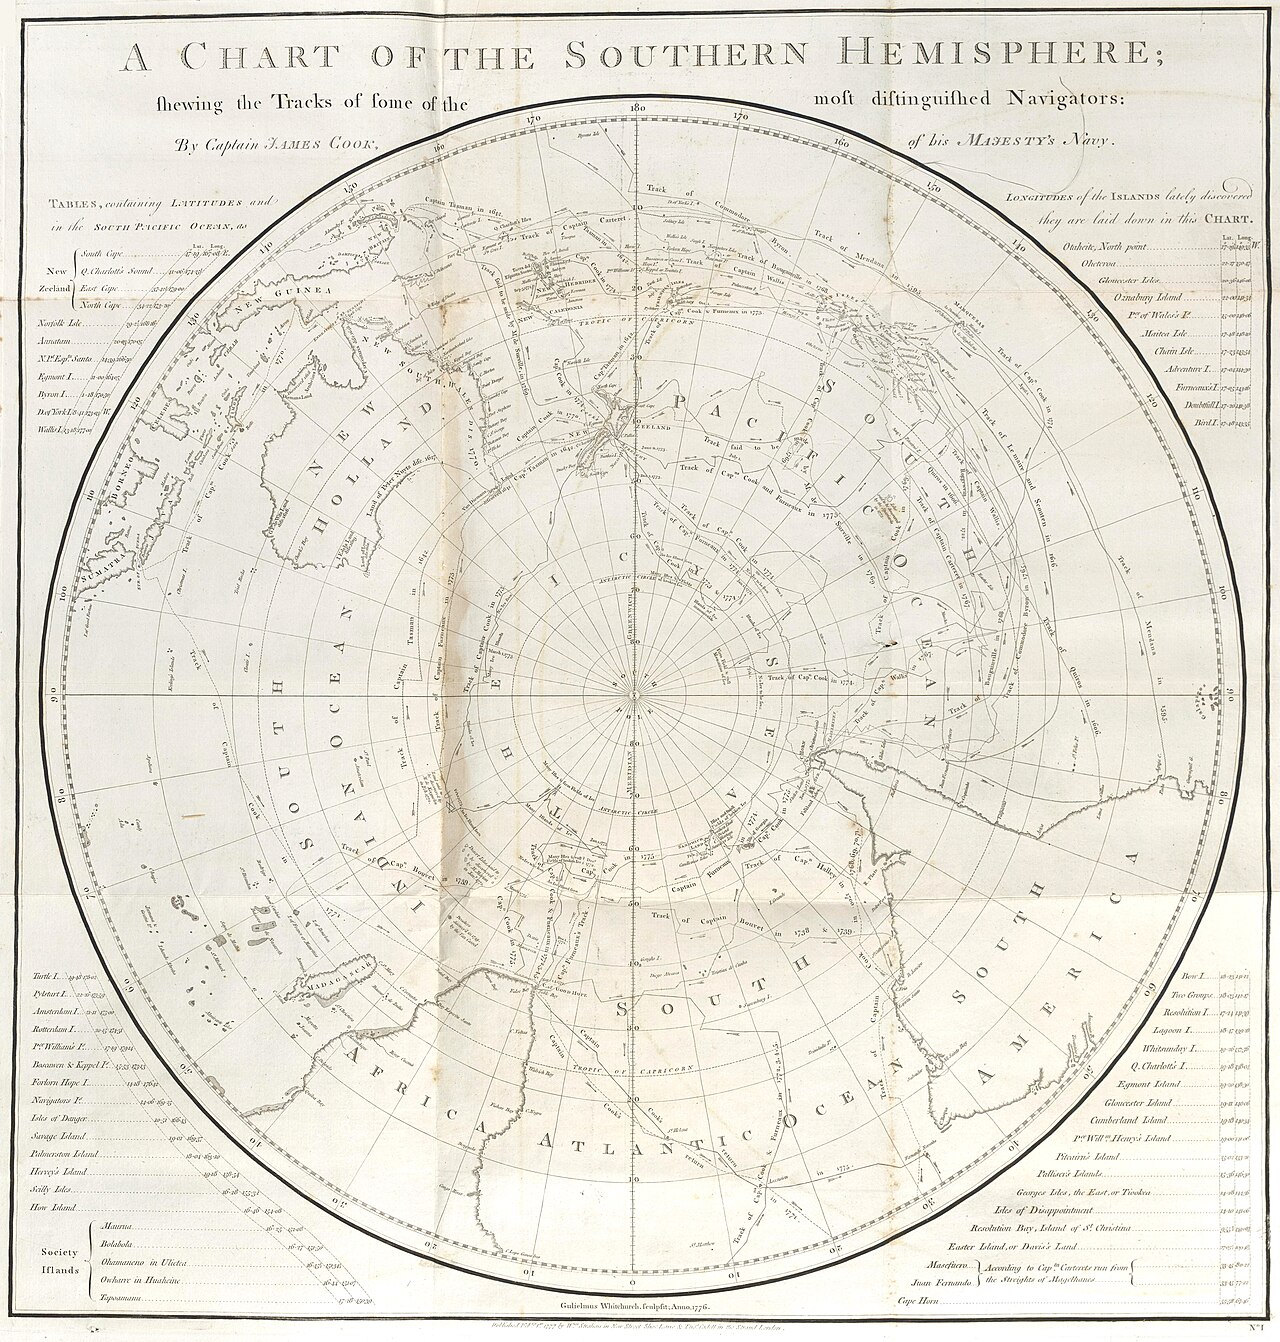
A Chart of the Southern Hemisphere
James Cook · 1776
A circular map by Captain James Cook from 1776 showing the tracks of famous navigators across the southern oceans, centered on the South Pole.
Cook authored this chart himself, summarizing his and other navigators' tracks across the southern oceans.
About this source
What it is
This is a polar projection map titled 'A Chart of the Southern Hemisphere,' made by Captain James Cook in 1776 and engraved by Gulielmus Whitchurch. It shows the routes taken by some of the most well-known navigators of the time.
Why it matters
This chart reflects how much new knowledge of the southern oceans had been gathered by Cook's era, much of it from his own voyages. It shows how European explorers tracked and recorded their journeys, piecing together a picture of the globe's southern half that was still being filled in.
Look closer
- Why might a mapmaker choose a circular projection centered on the South Pole instead of a standard rectangular map?
- What do the labeled regions (New Holland, Pacific Ocean, South America, Africa, Atlantic Ocean) tell you about what was known and unknown at the time?
- Whose voyages are shown here, and whose are missing?
This document is part of the curated material that grounds the AI version of James Cook on Humy.ai — when students ask about related events, the AI can quote it and cite it.
More James Cook sources
Meet the AI James Cook →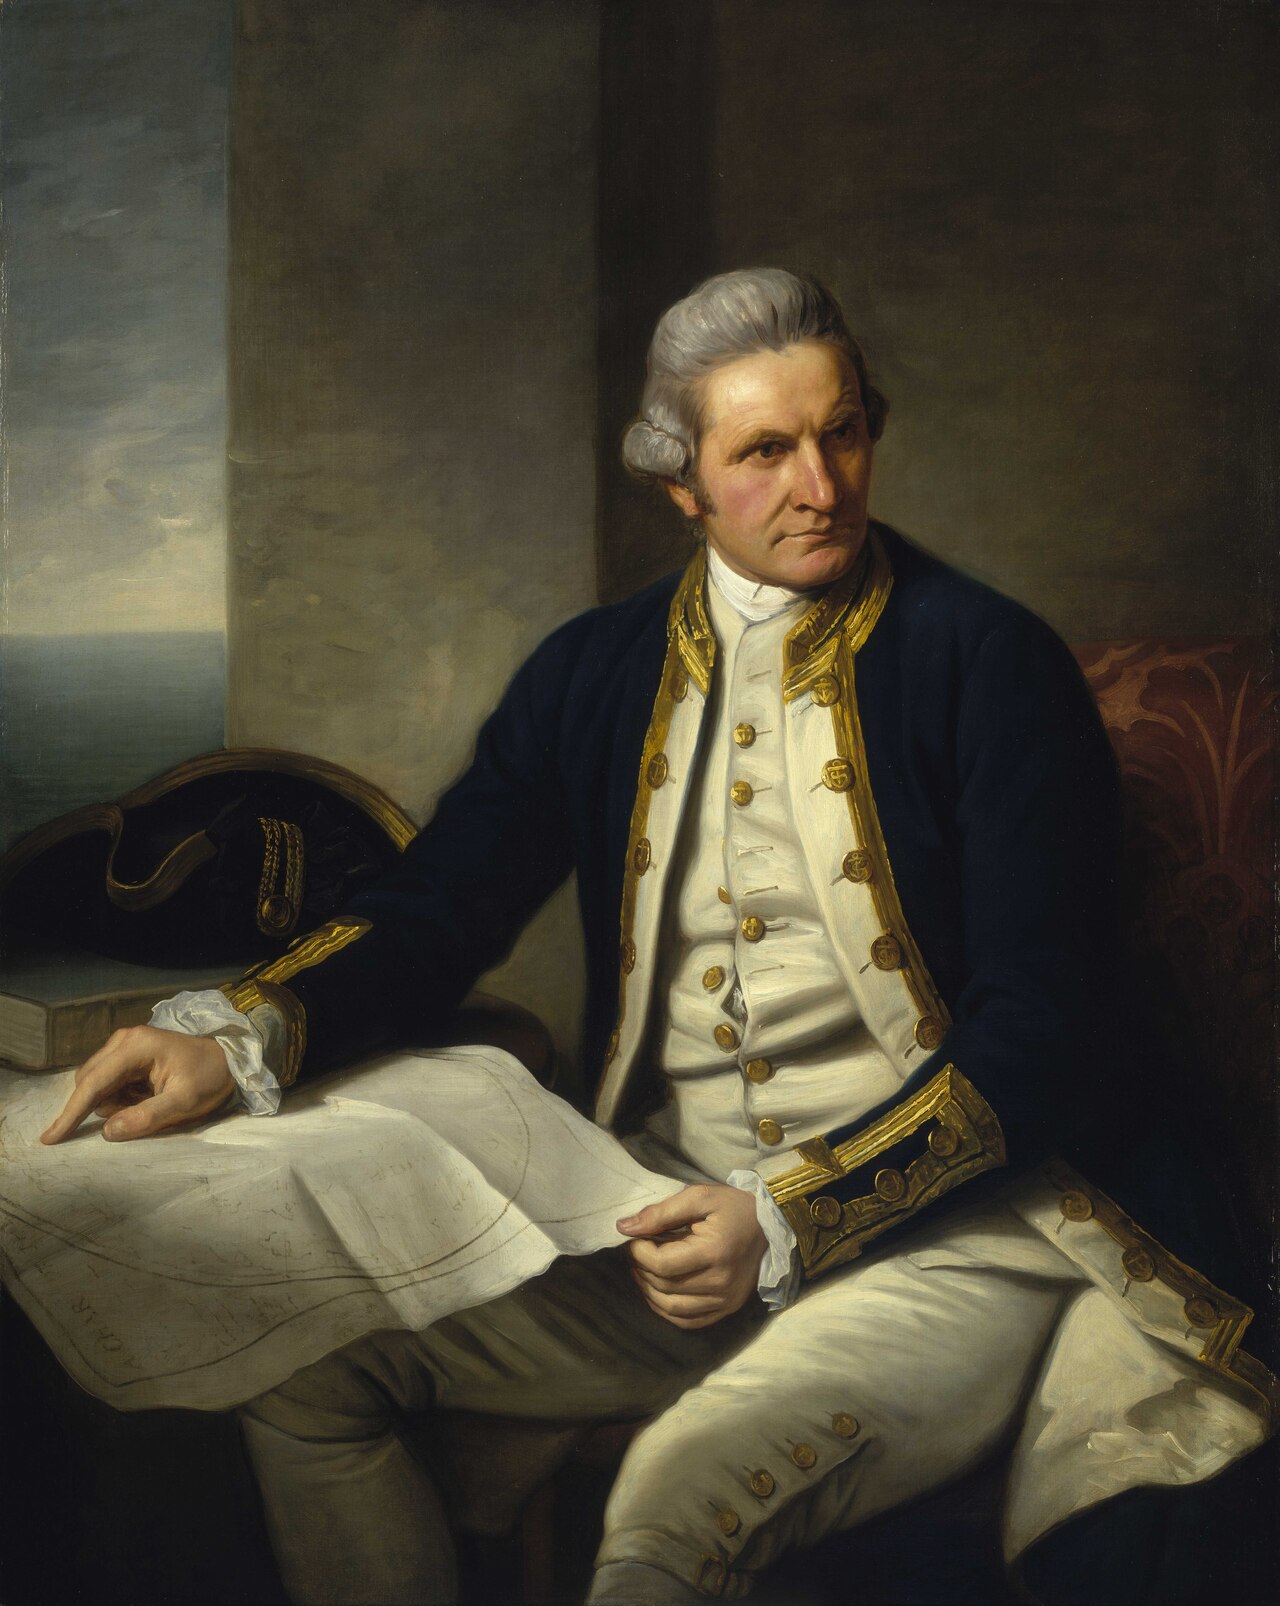 Painting
Primary source
Captain James Cook, 1728-79
Nathaniel Dance-Holland · c. 1775-1776
 Painting
Secondary source
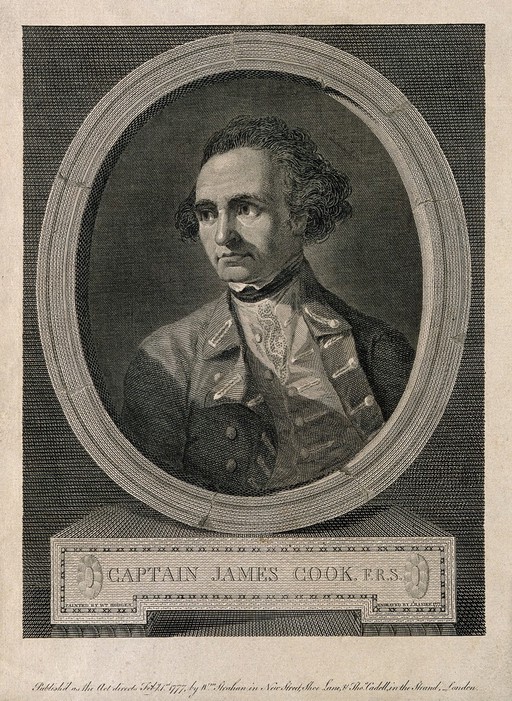
James Cook, line engraving by Basire after Hodges
William Hodges · 1777
 Document
Primary source
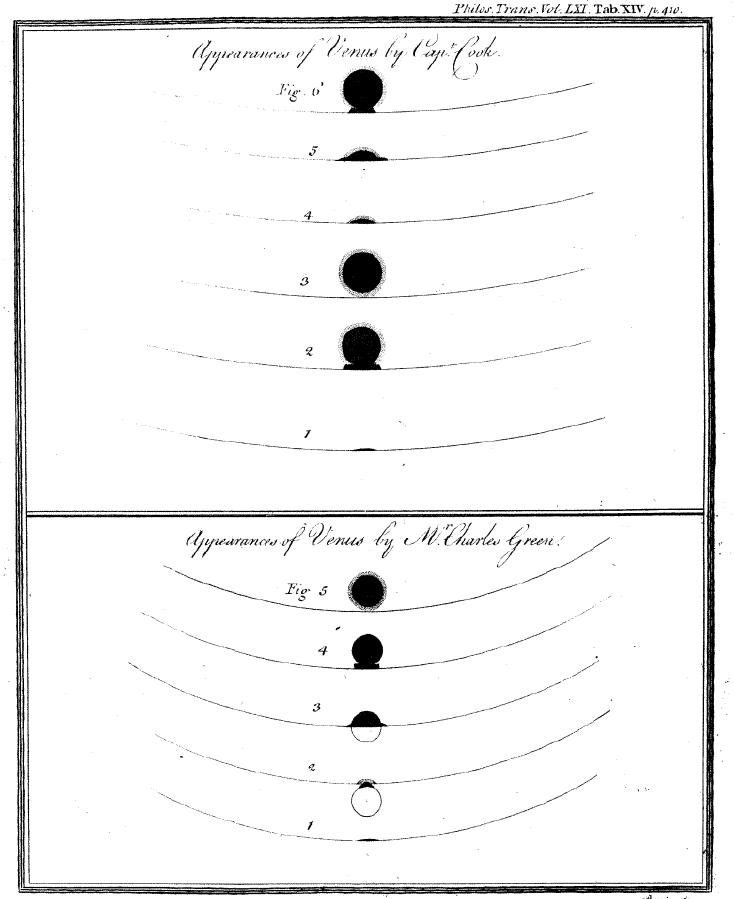
Sketchings of the 1769 Venus Transit
James Cook and Charles Green · 1769
 Painting
Primary source
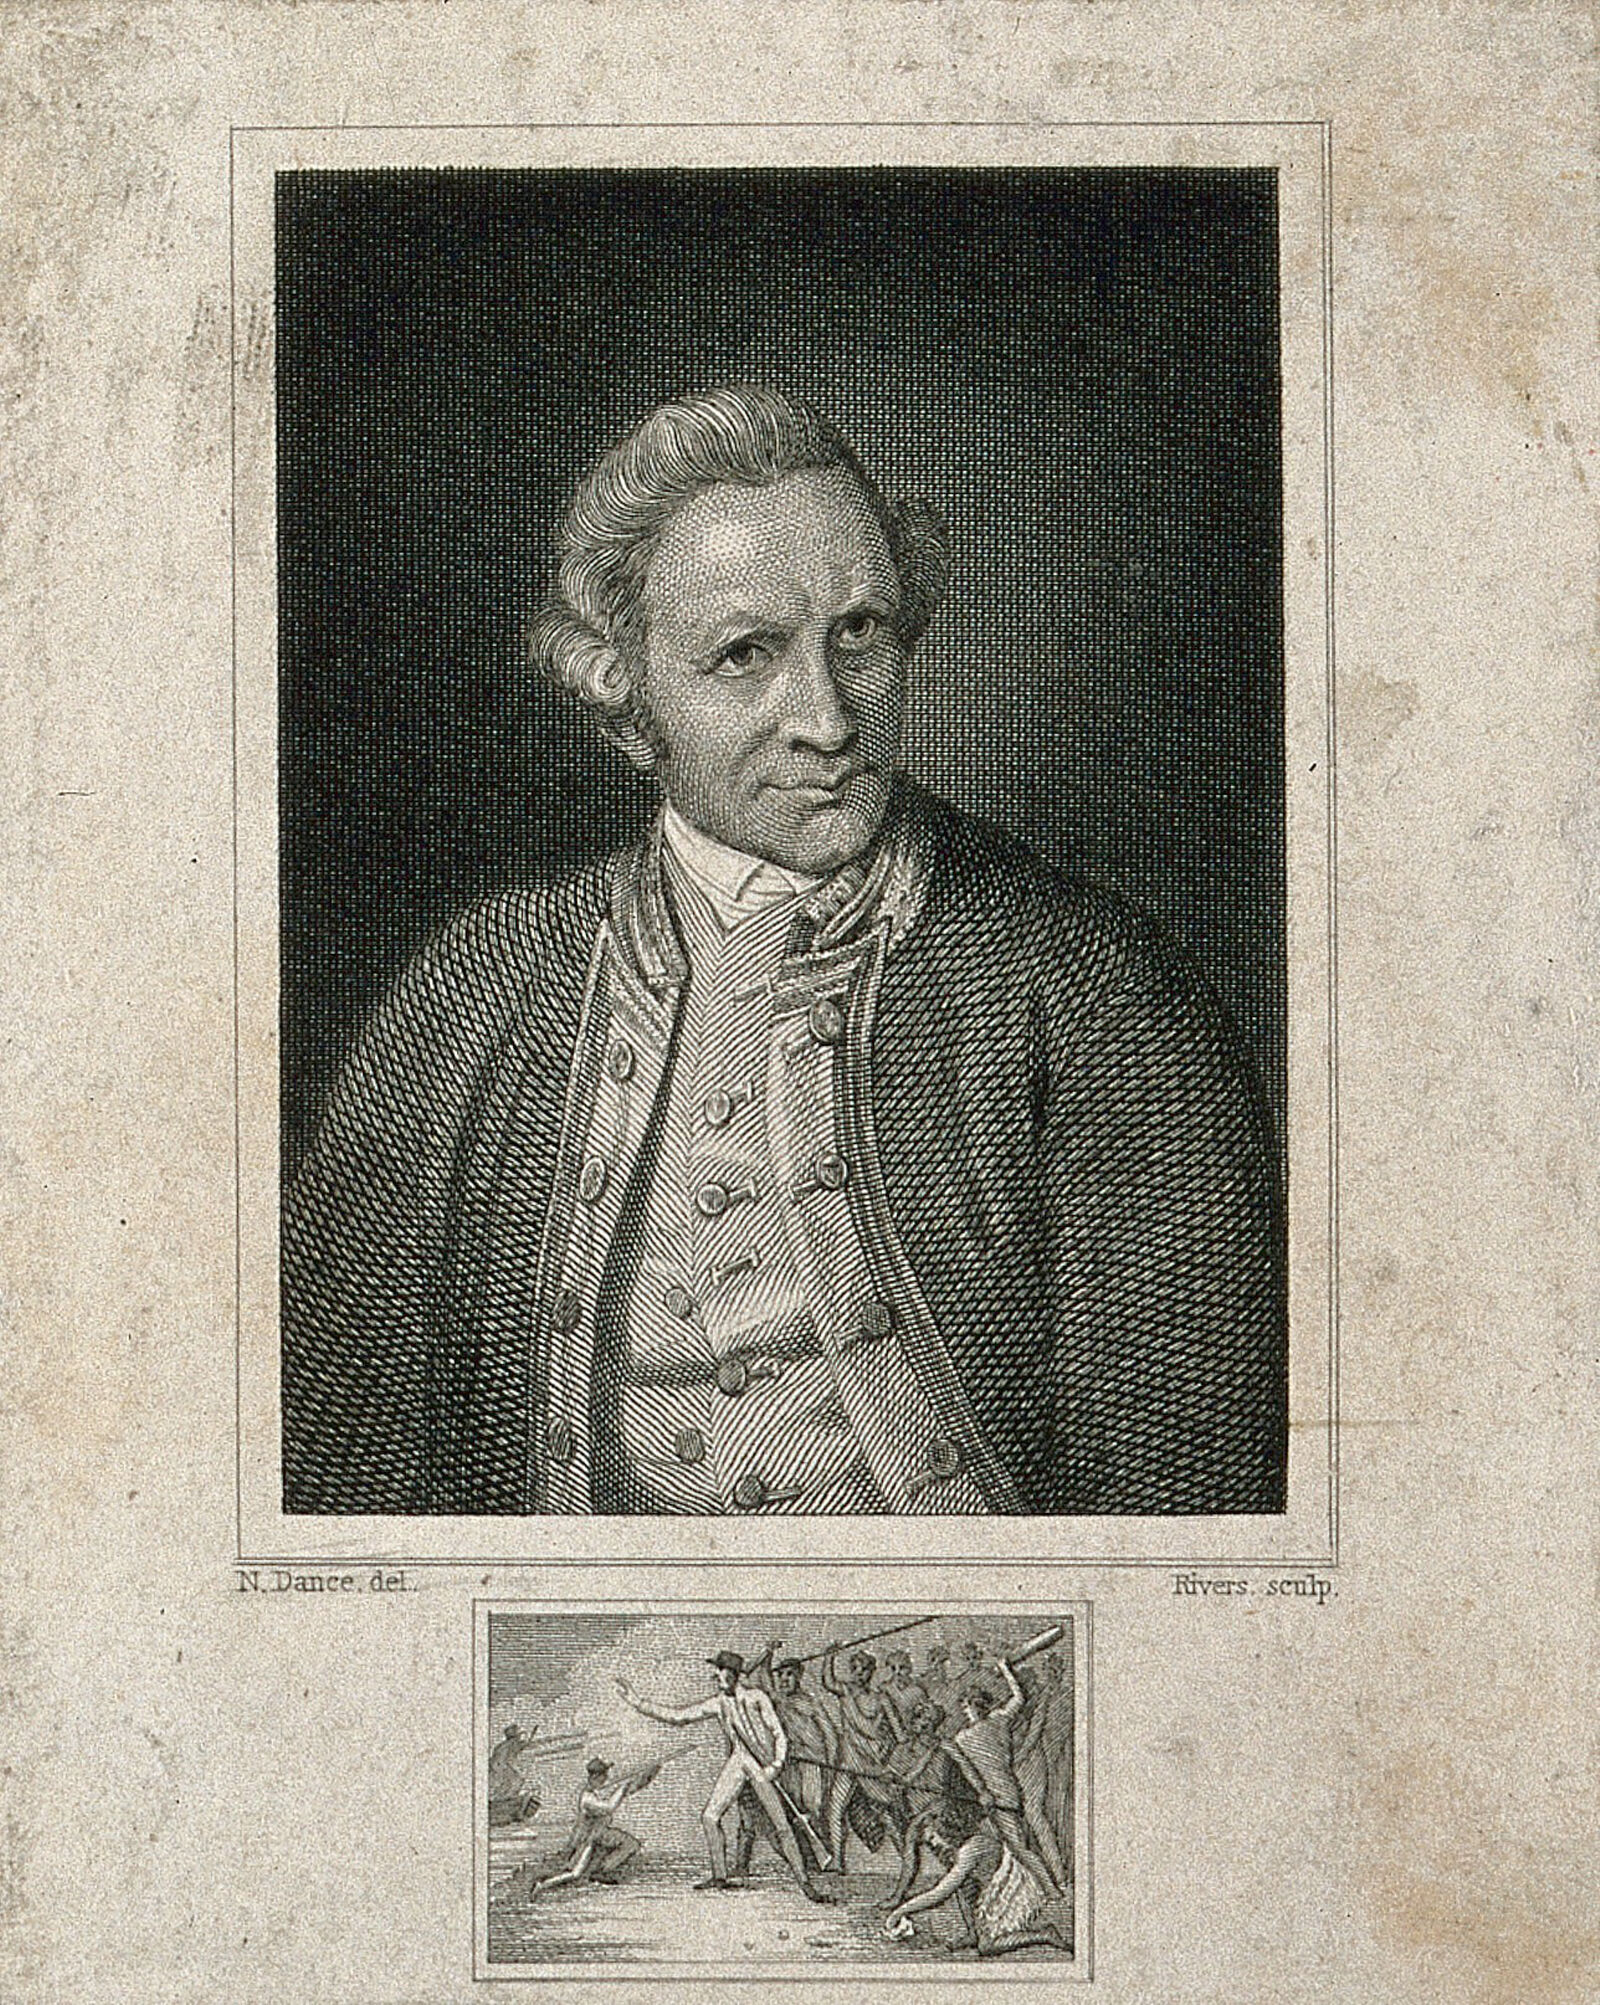
James Cook, engraving by Rivers after Dance-Holland
Nathaniel Dance-Holland · 1776
 Document
Primary source
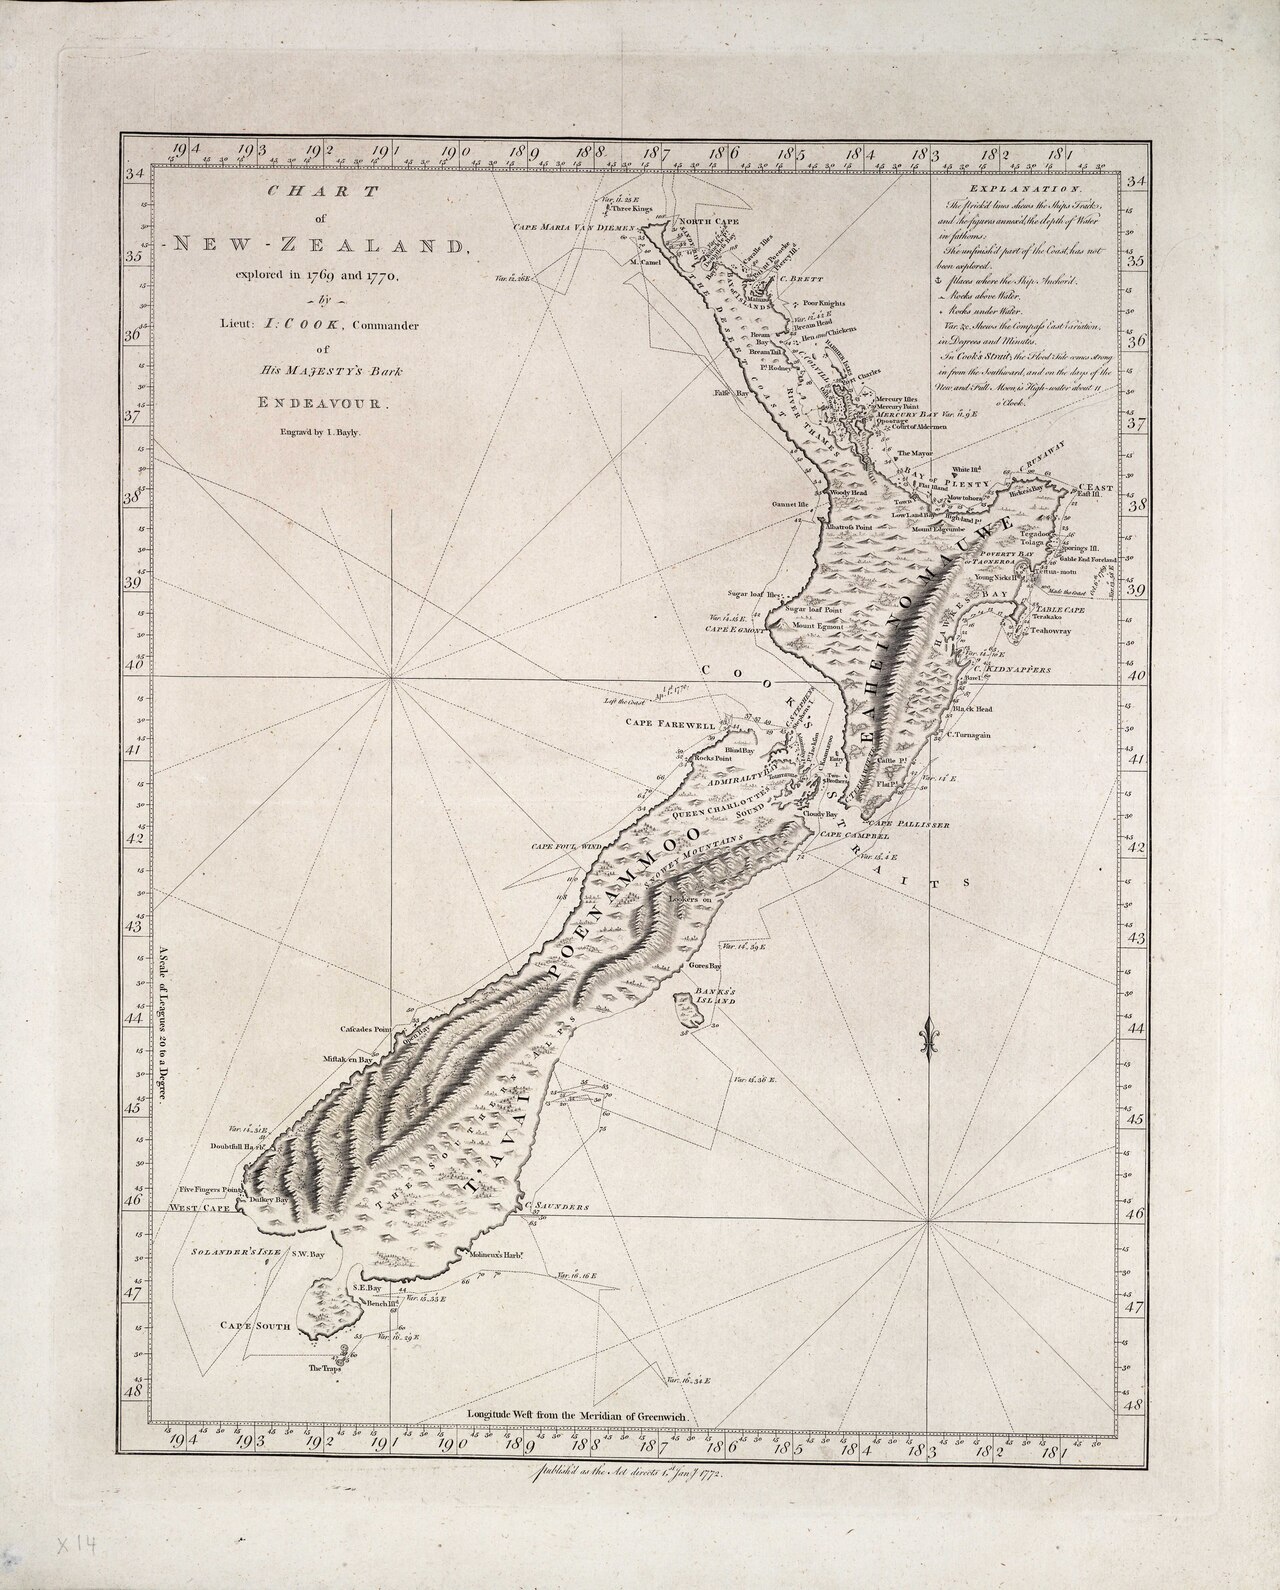
Chart of New Zealand, explored in 1769 and 1770
James Cook · 1770
Ready when you are
Start chatting with James Cook now.
20 messages free · No credit card · Available in 50+ languages.