


Primary sourceDocument1858
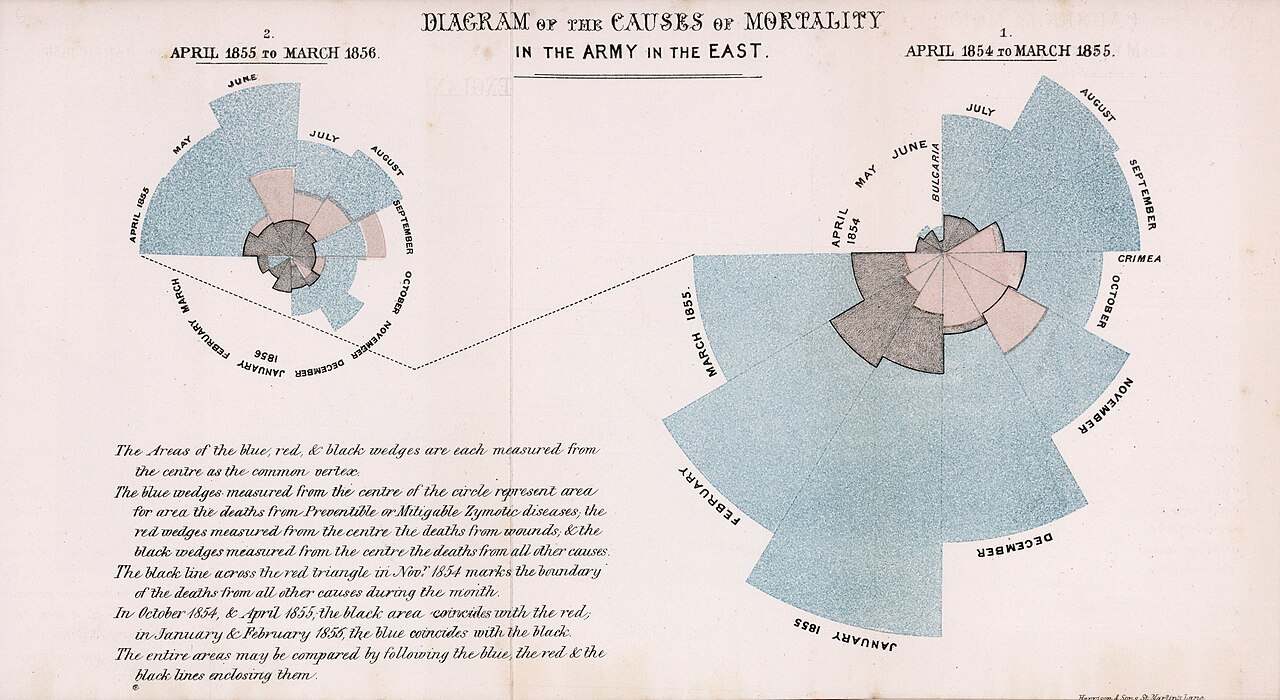
Diagram of the Causes of Mortality in the Army in the East
Florence Nightingale · 1858
Nightingale's 1858 polar area diagram, nicknamed the 'coxcomb', showing that disease killed far more soldiers in the Crimean War than wounds did.
She created this diagram to use statistics as evidence for reforming army health, a defining act of her career.
About this source
What it is
A statistical diagram made by Florence Nightingale in 1858, using two circular charts divided into coloured wedges to show monthly deaths among British troops in the Crimean War. It was published in a report on army health and sent to Queen Victoria.
Why it matters
The blue wedges, representing deaths from preventable disease, dominate the chart compared to the red wedges for deaths from wounds. Nightingale used this visual argument to persuade officials and the Queen that poor sanitation, not combat, was the army's biggest killer. It shows her skill as a statistician and her determination to use evidence to drive reform of army medical care.
Look closer
- Why might a picture convince people more quickly than a table of numbers?
- What story do the colours tell about why soldiers were dying?
- Who was the intended audience for this diagram, and why did that matter?
This document is part of the curated material that grounds the AI version of Florence Nightingale on Humy.ai — when students ask about related events, the AI can quote it and cite it.
More Florence Nightingale sources
Meet the AI Florence Nightingale →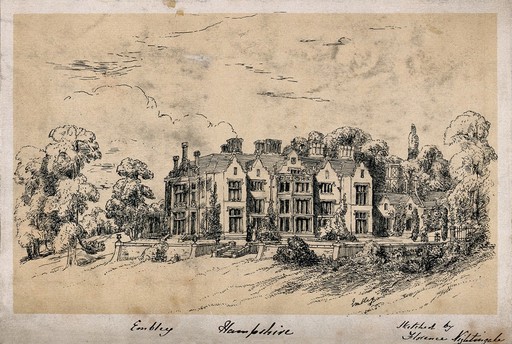 Painting
Primary source
Embley Park, Hampshire
Florence Nightingale · 1854
Primary source
Recording of the voice of Florence Nightingale
Florence Nightingale · 1890
 Painting
Primary source
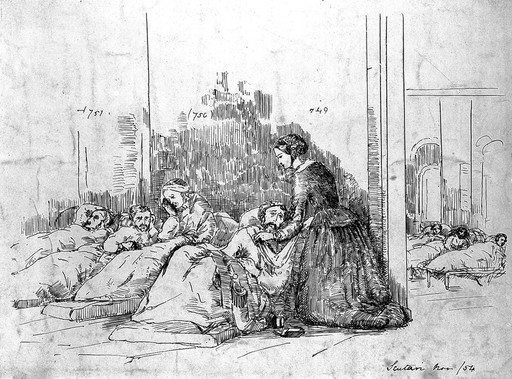
Lithograph of Florence Nightingale, 1854
1854
 Painting
Secondary source
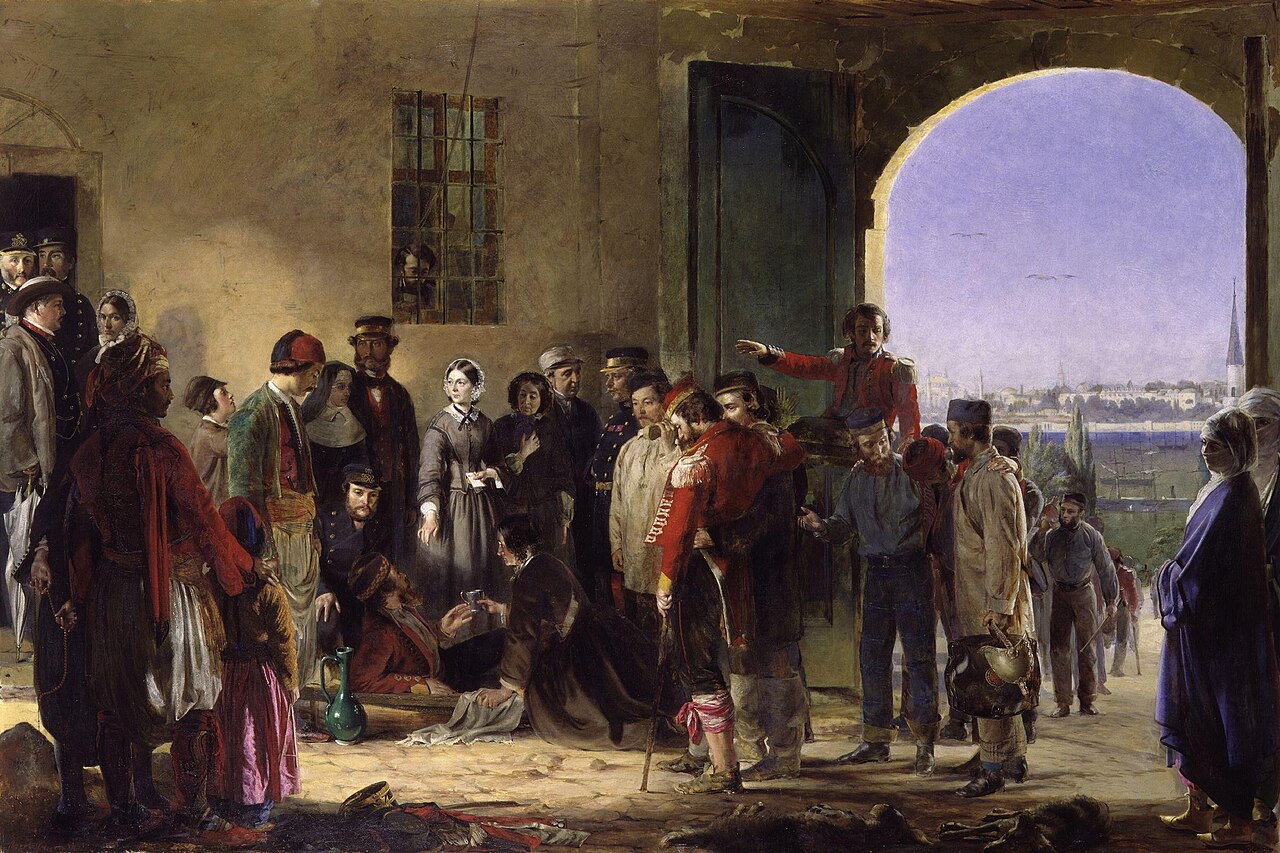
The Mission of Mercy: Florence Nightingale receiving the Wounded at Scutari
Jerry Barrett · 1857
 Photograph
Primary source
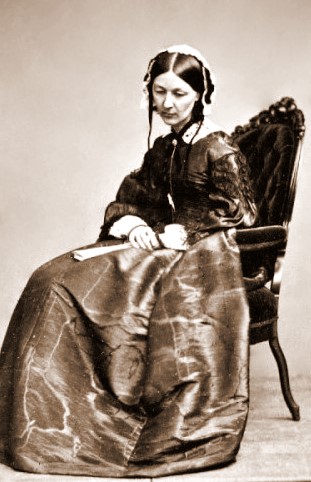
Florence Nightingale by Kilburn c1854
Kilburn · c. 1854
Ready when you are
Start chatting with Florence Nightingale now.
20 messages free · No credit card · Available in 50+ languages.