


Primary sourceDocument1904
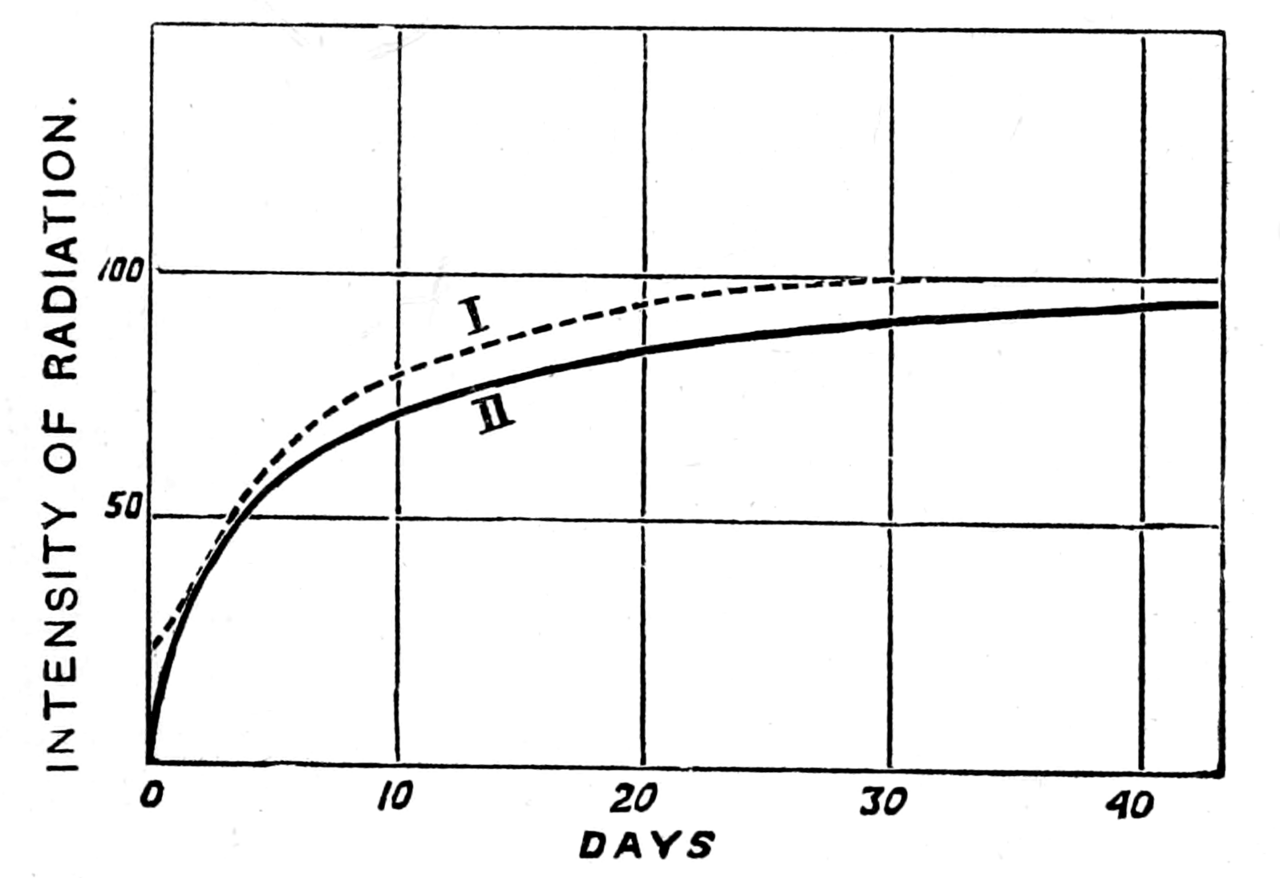
Figure 12 from Radio-active Substances
1904
A diagram from Curie's 1904 book Radio-active Substances, graphing the intensity of radiation over time.
This diagram comes from Curie's own 1904 published book on radioactivity, part of her scientific legacy.
About this source
What it is
This is a diagram, Figure 12, from a scanned copy of Marie Curie's 1904 book Radio-active Substances, published by the Chemical News Office in London. It is a line graph plotting 'Intensity of Radiation' against the number of days, with two curves rising and leveling off over about 43 days.
Why it matters
This diagram is part of Curie's own published scientific work explaining radioactivity, one of the key subjects of her research with Pierre Curie. It shows how she used graphs to present experimental data clearly, helping readers understand how radioactive intensity changes over time, a core finding of her research.
Look closer
- What do the two curves suggest about different radioactive samples or conditions?
- Why might a scientist choose to show results as a graph rather than just numbers in a table?
- What information might be missing from this single figure that the rest of the book would explain?
This document is part of the curated material that grounds the AI version of Marie Curie on Humy.ai — when students ask about related events, the AI can quote it and cite it.
More Marie Curie sources
Meet the AI Marie Curie →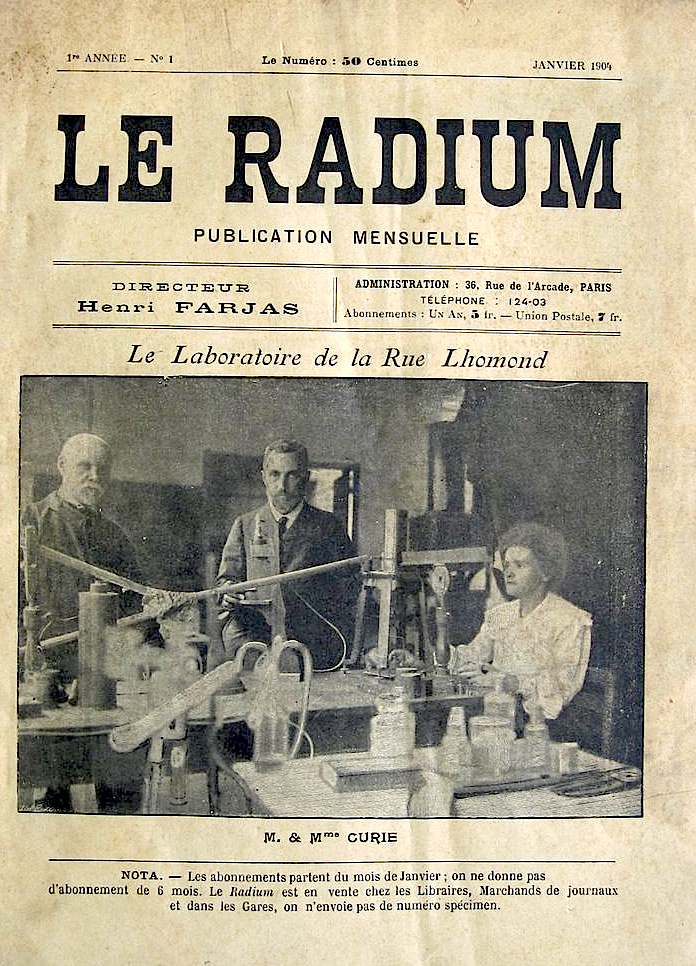 Photograph
Primary source
Photograph of Pierre and Marie Curie in their Laboratory, rue Lhomond
c. 1898-1904
 Book
Primary source
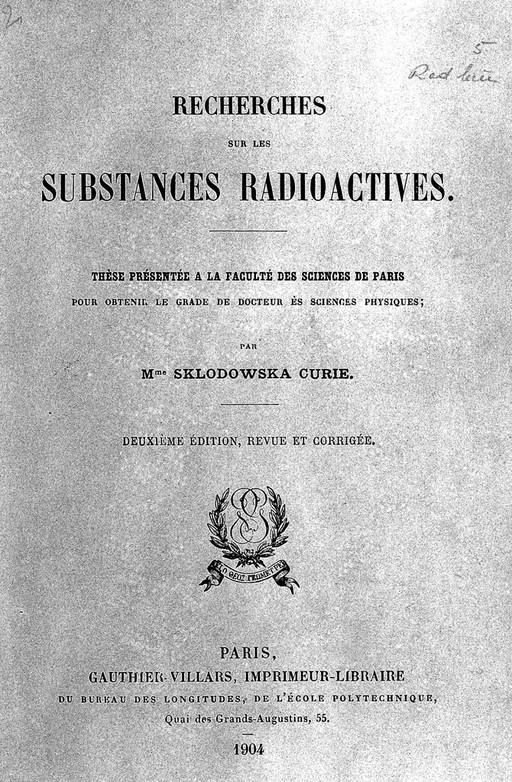
Recherches sur les substances radioactives
Marie Curie · 1904
Primary source
Rayons émis par les composés de l'uranium et du thorium
Marie Curie · 12 April 1898
 Artifact
Primary source
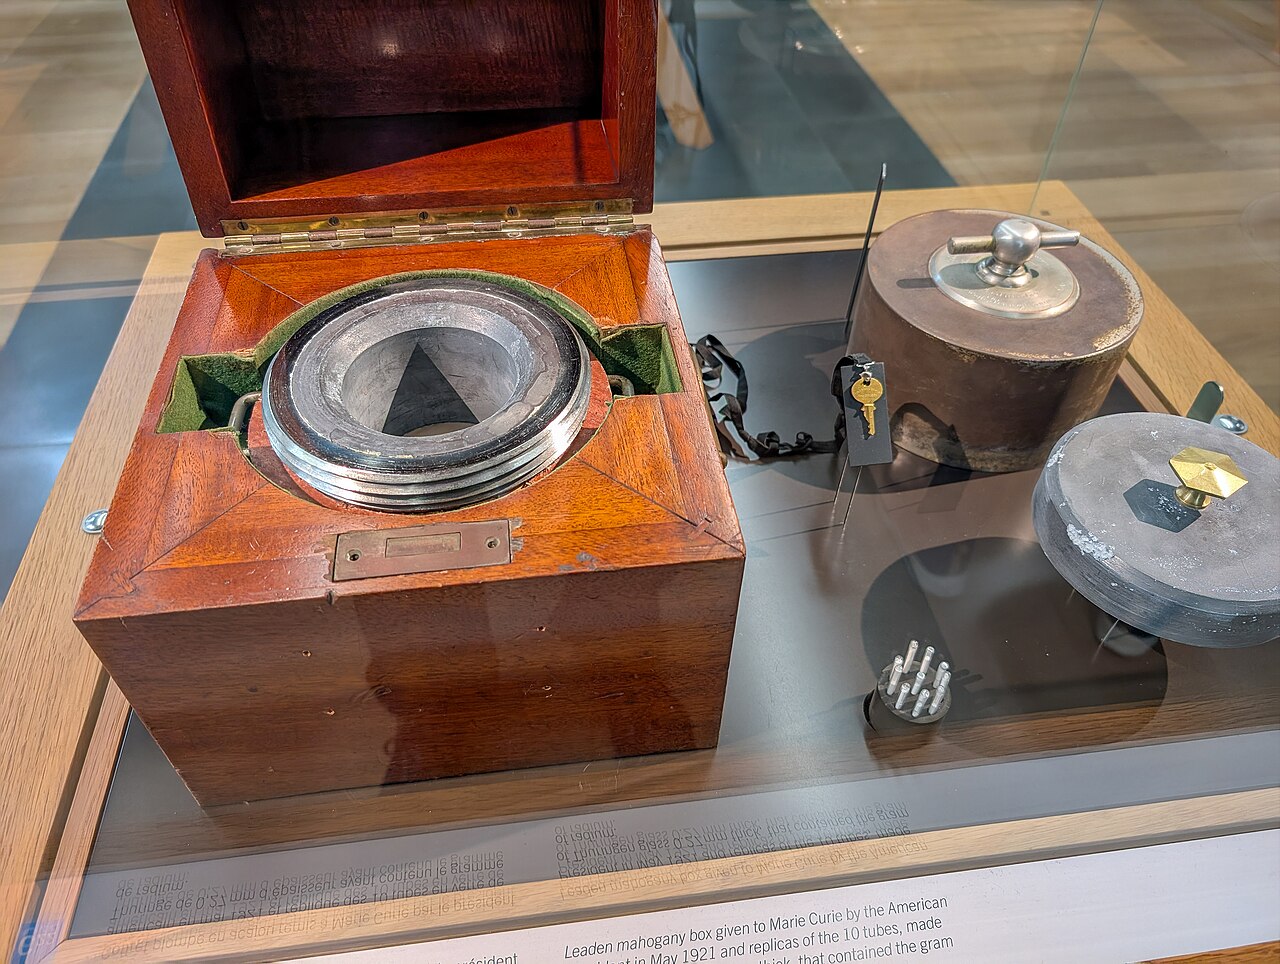
International Radium Standard
Marie Curie · 1911
 Artifact
Primary source
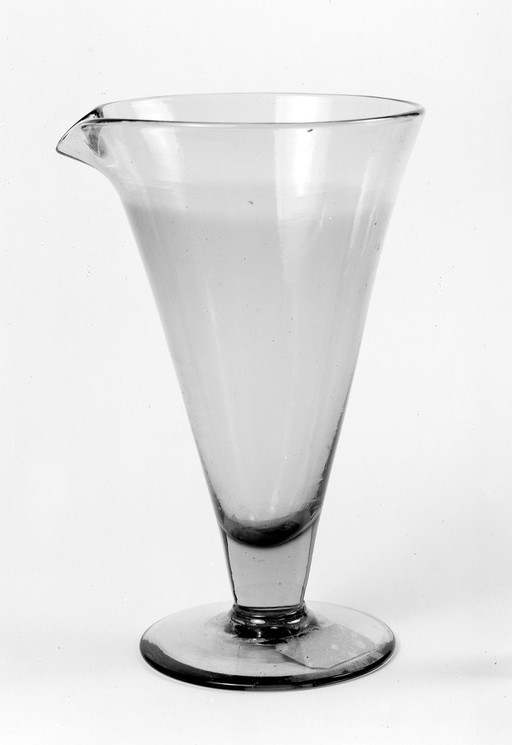
Glass beaker used for the first radium salt solution
Ready when you are
Start chatting with Marie Curie now.
20 messages free · No credit card · Available in 50+ languages.