


Secondary sourceArtifact19 July 2014
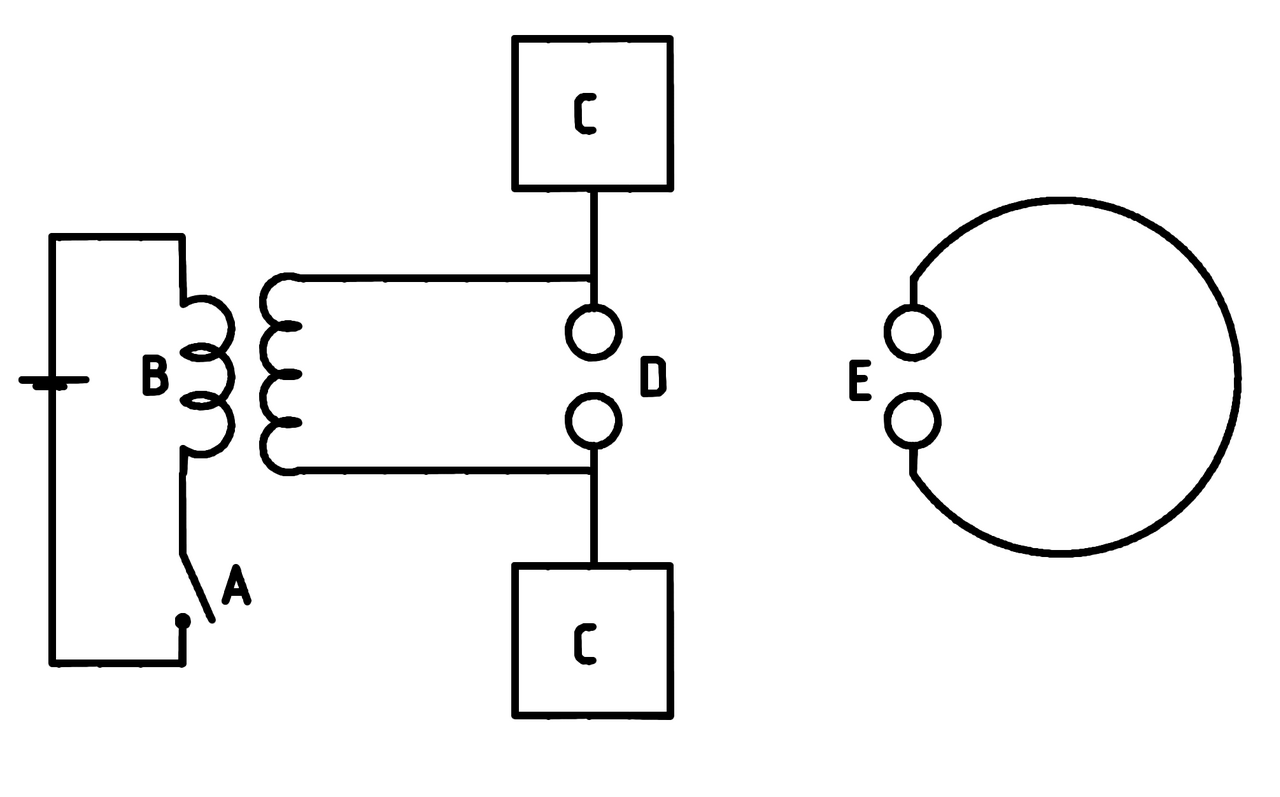
Outline Diagram of Hertz's Experiment
MdeVicente · 19 July 2014
A labelled diagram showing the main components of the 1887 experiment Hertz used to detect radio waves.
This diagram outlines the components of the experiment Hertz used to discover radio waves.
About this source
What it is
This diagram, made in 2014, outlines the key parts of the experiment Heinrich Hertz used to detect radio waves: a switch, transformer, metal plates, spark gap, and a separate receiver loop.
Why it matters
By breaking the experiment down into labelled parts, this diagram helps explain how Hertz generated and detected electromagnetic waves, confirming predictions that had been made in theoretical physics and leading to the technology of wireless communication.
Look closer
- Why might breaking the apparatus into labelled letters (A, B, C, D, E) make the experiment easier to understand?
- What is the function of each labelled part, and how do they work together?
- What does this simplified diagram leave out about the real complexity of the equipment Hertz used?
This artifact is part of the curated material that grounds the AI version of Heinrich Hertz on Humy.ai — when students ask about related events, the AI can quote it and cite it.
More Heinrich Hertz sources
Browse all 65 →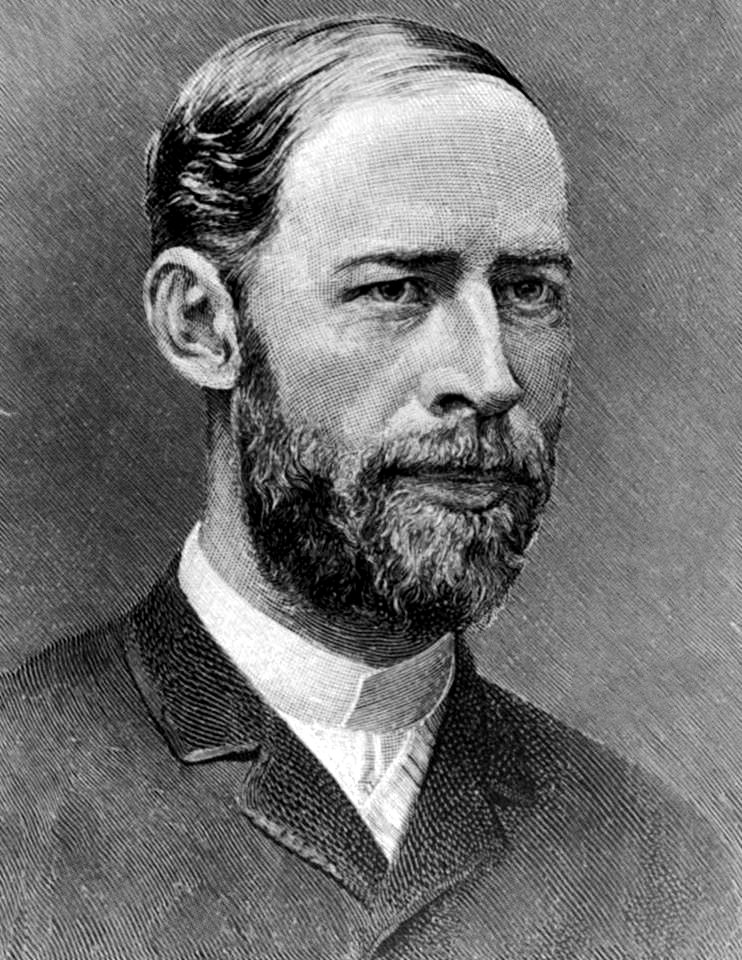 Photograph
Primary source
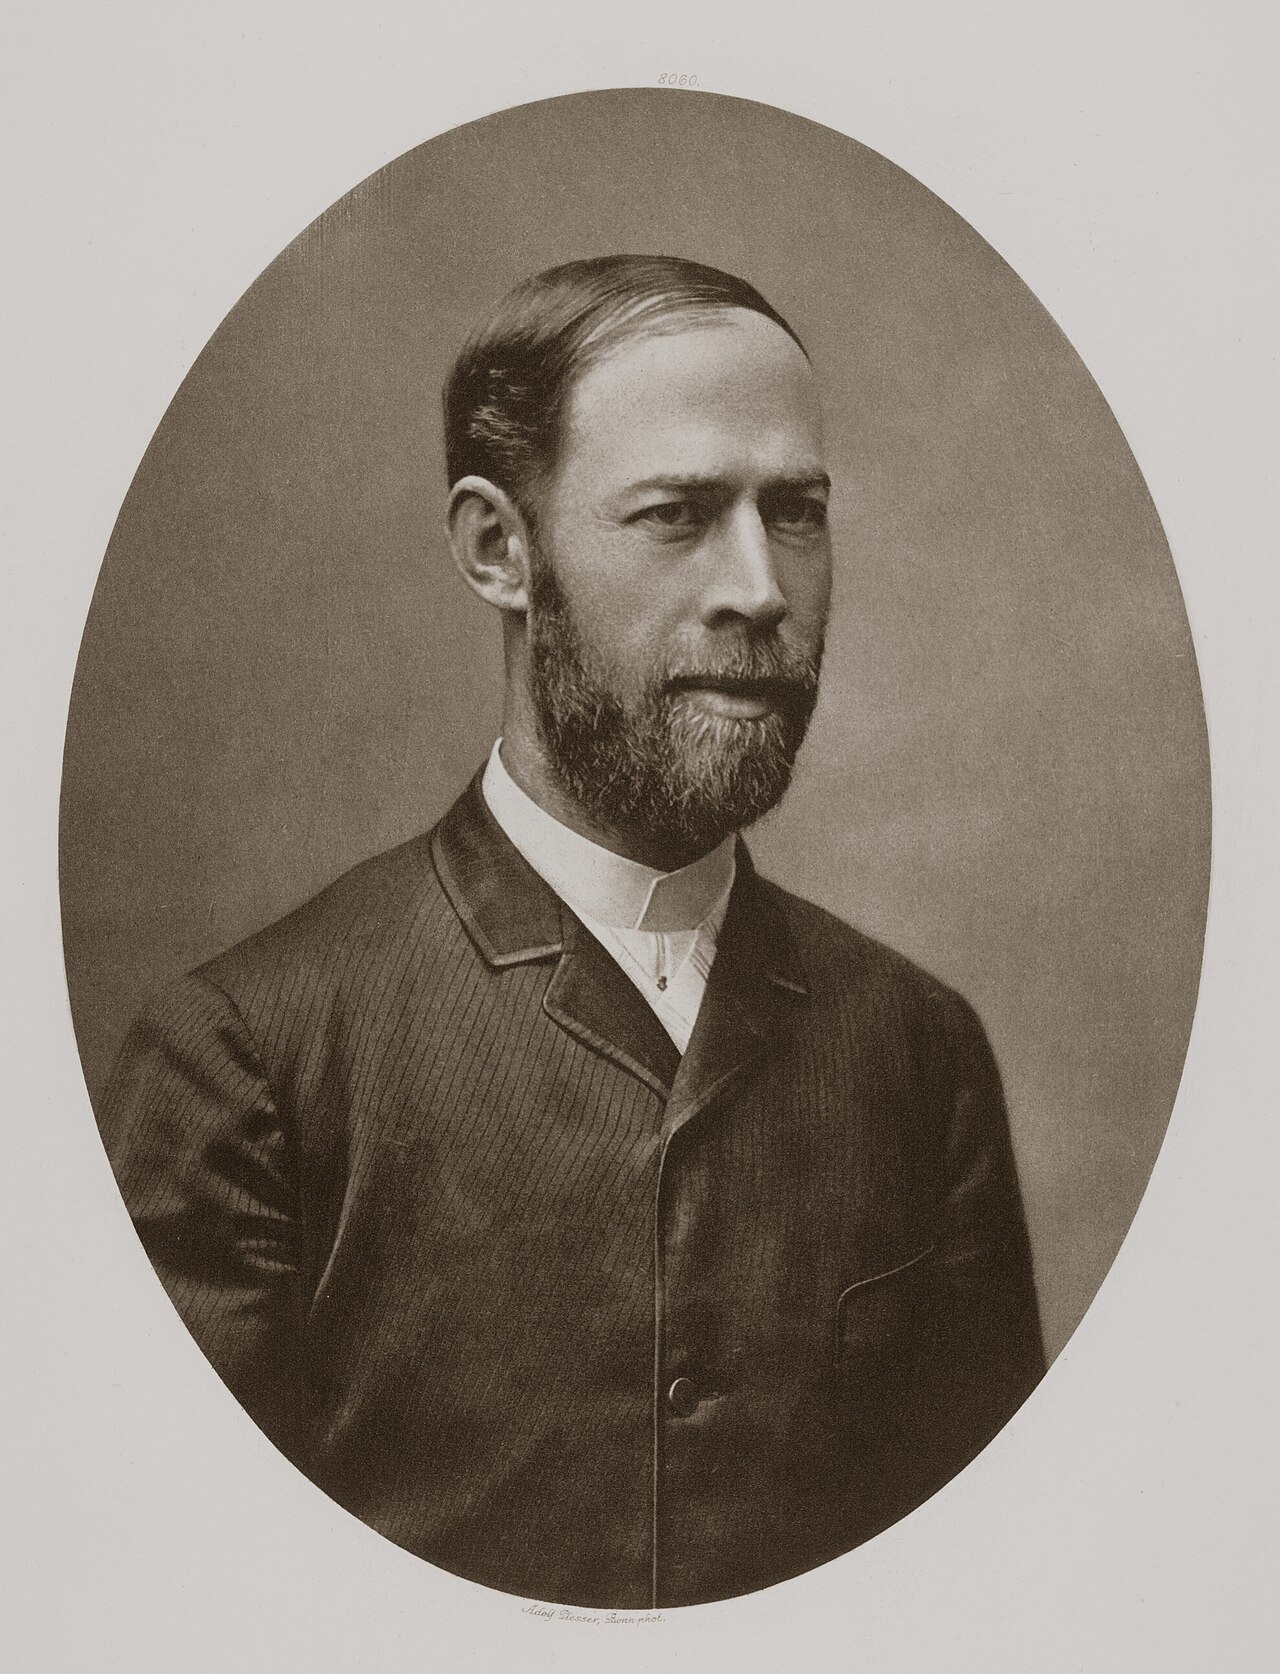
Heinrich Hertz
Robert Krewaldt
 Speech
Secondary source
The Work of Hertz (Royal Institution lecture)
Oliver Lodge · 1 June 1894
 Artifact
Primary source
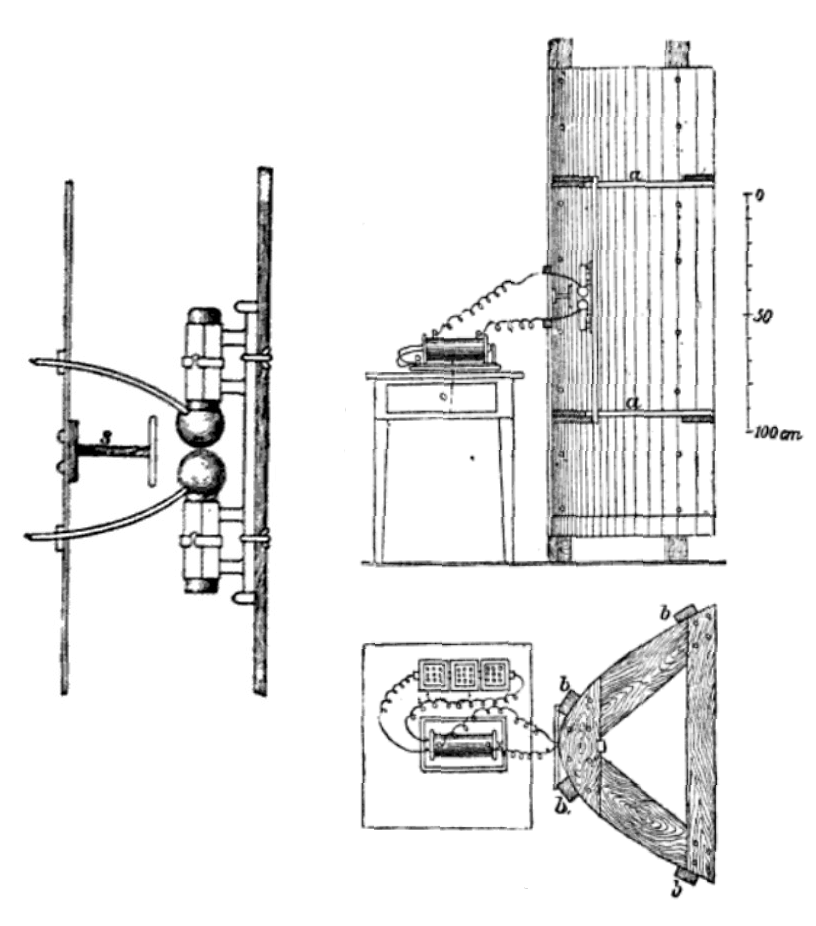
Hertz Spark Gap Transmitter and Parabolic Antenna
Heinrich Hertz · 1888 (published 1893)
 Document
Primary source
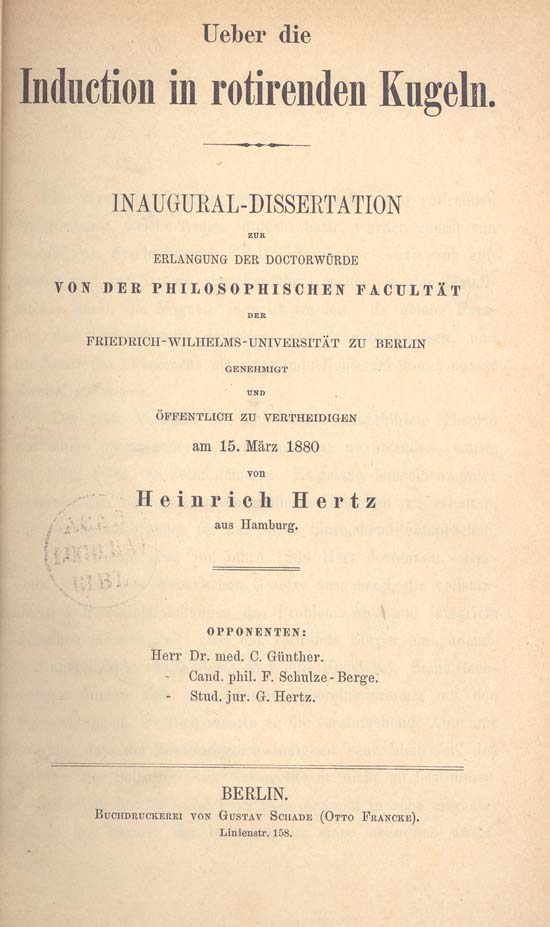
Ueber die Induction in rotirenden Kugeln
Heinrich Hertz · 1880


Free account
Read every Heinrich Hertz source
Sign up free →
Ready when you are
Start chatting with Heinrich Hertz now.
20 messages free · No credit card · Available in 50+ languages.