


Primary sourceArtifact1979
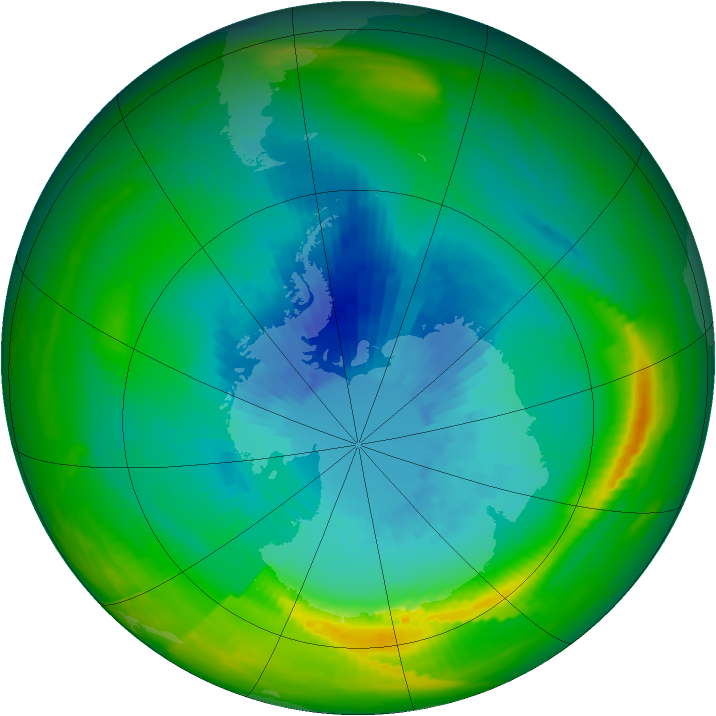
Southern Hemisphere Ozone Hole, 1979
NOAA · 1979
A 1979 satellite image showing Antarctic ozone levels dropping below a key threshold for the first time, part of the data behind the discovery Mario Molina helped make.
Early satellite data recording the ozone depletion whose chemical cause Molina's research identified.
About this source
What it is
This colour-coded satellite image was produced from data gathered by the Total Ozone Mapping Spectrometer aboard NASA's Nimbus-7 satellite in 1979. It shows ozone levels over the Southern Hemisphere, with blue and purple marking the lowest concentrations over Antarctica.
Why it matters
From this satellite's data, scientists discovered that Antarctic ozone levels had dropped below 200 Dobson Units for the first time on record, a threshold that later became the standard definition of the ozone hole. This was part of the scientific record that supported the warnings made by chemists such as Mario Molina about the dangers of ozone-depleting chemicals.
Look closer
- Why do you think scientists needed satellites, rather than ground measurements alone, to understand this problem?
- What does the choice of colours in the image help you see, and what might it hide or simplify?
- How does a single number like
This artifact is part of the curated material that grounds the AI version of Mario Molina on Humy.ai — when students ask about related events, the AI can quote it and cite it.
More Mario Molina sources
Browse all 17 →Primary source
Montreal Protocol
1987
 Artifact
Primary source
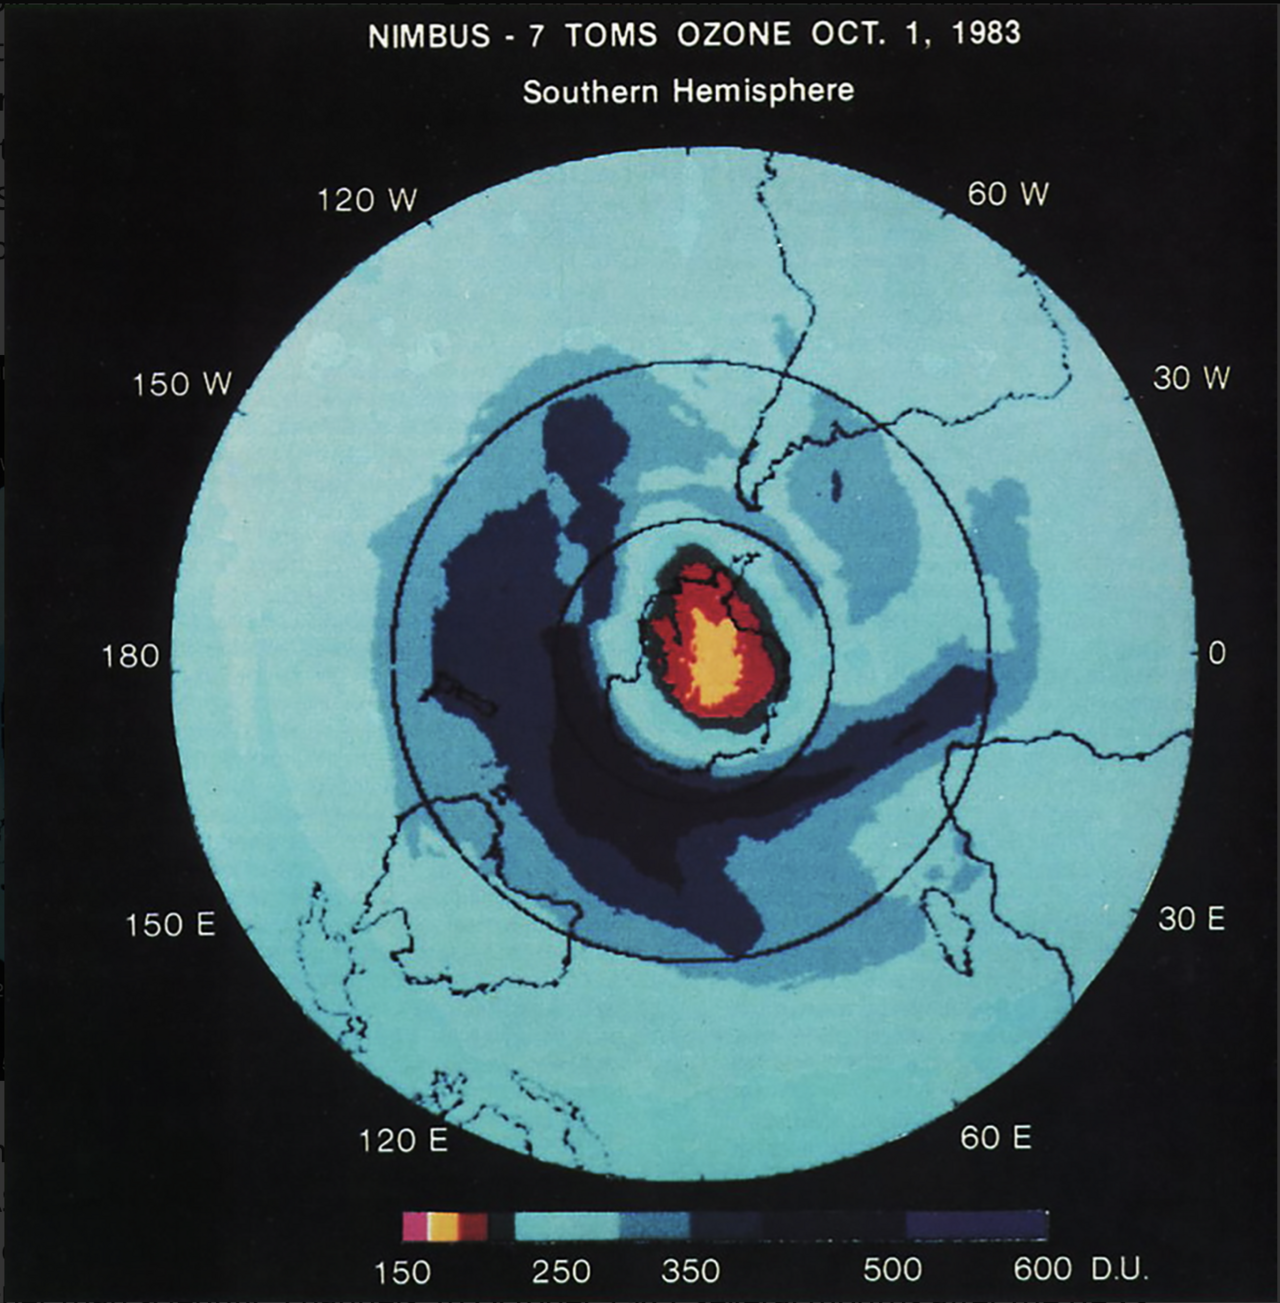
Satellite Map of Ozone over Antarctica, 1983
NASA · 1 October 1983
Secondary source
Presidential Medal of Freedom Recipient: Mario Molina
The White House · 2013
 Photograph
Primary source
Portrait of Mario Molina
2011

Free account
Read every Mario Molina source
Sign up free →
Ready when you are
Start chatting with Mario Molina now.
20 messages free · No credit card · Available in 50+ languages.