


Primary sourceDocument1897
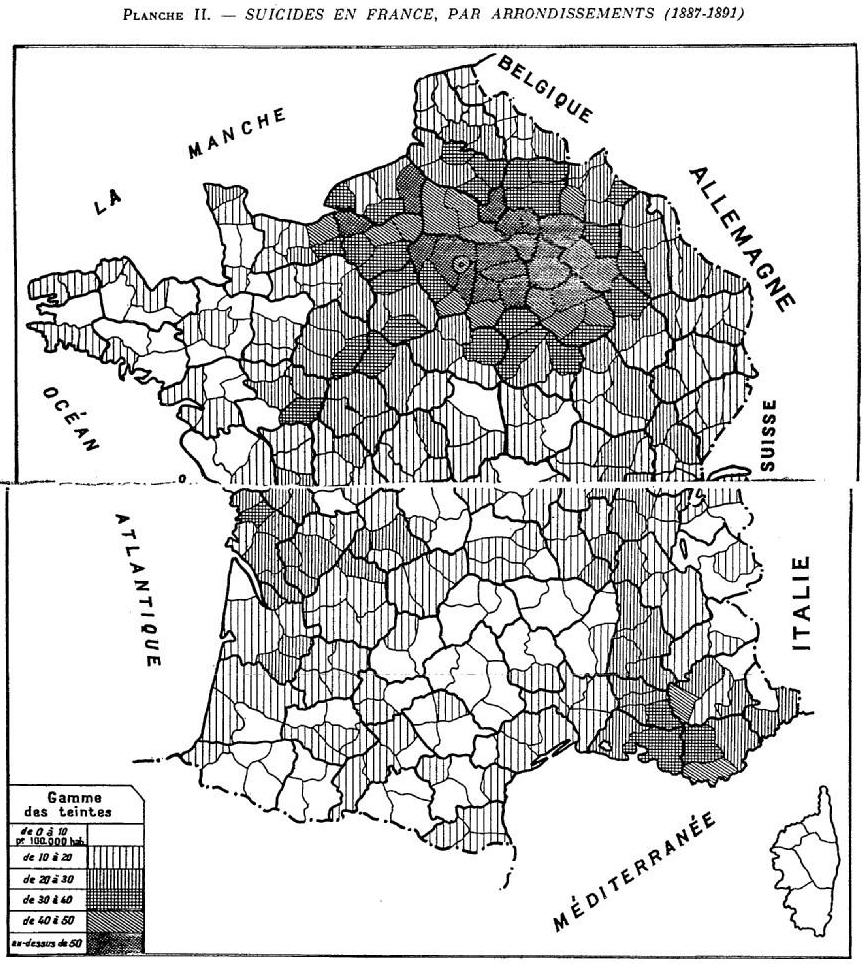
Suicide and Alcoholism Map
Émile Durkheim · 1897
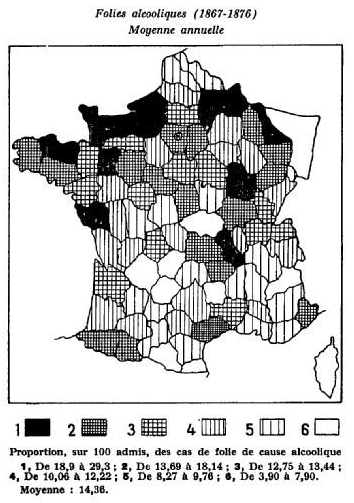
A statistical map from Durkheim's Suicide comparing suicide rates with alcoholism across France.
Durkheim created this map to test and refute individualist explanations of suicide, central to his theory.
About this source
What it is
Made by Émile Durkheim for Le Suicide, this map shows rates of alcoholic insanity across French regions between 1867 and 1876, using six shaded levels and a legend giving the ranges and average.
Why it matters
Durkheim used this map to argue against the common belief that individual problems like alcoholism directly caused high suicide rates. By comparing geographic patterns, he tried to show that social, not purely individual, causes were behind differences in suicide.
Look closer
- Why would comparing two different maps help test whether alcoholism explains suicide?
- What does this map suggest about how Durkheim built his arguments using data?
- What assumptions does mapping disease or behavior by region make, and what might it hide?
This document is part of the curated material that grounds the AI version of Emile Durkheim on Humy.ai — when students ask about related events, the AI can quote it and cite it.
More Emile Durkheim sources
Browse all 59 →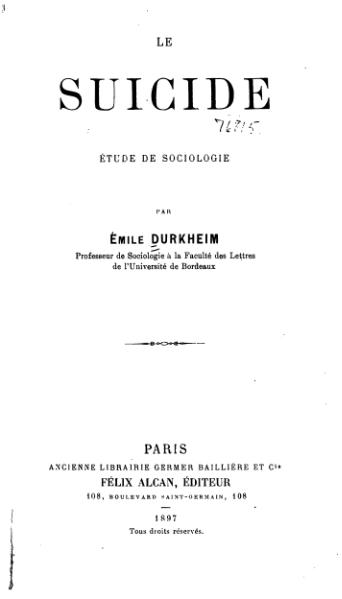 Book
Primary source
Suicide
Émile Durkheim · 1897
 Book
Primary source
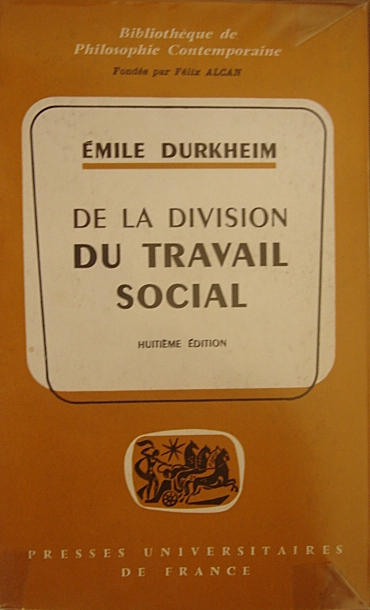
The Division of Labour in Society
Émile Durkheim · 1893
 Book
Primary source
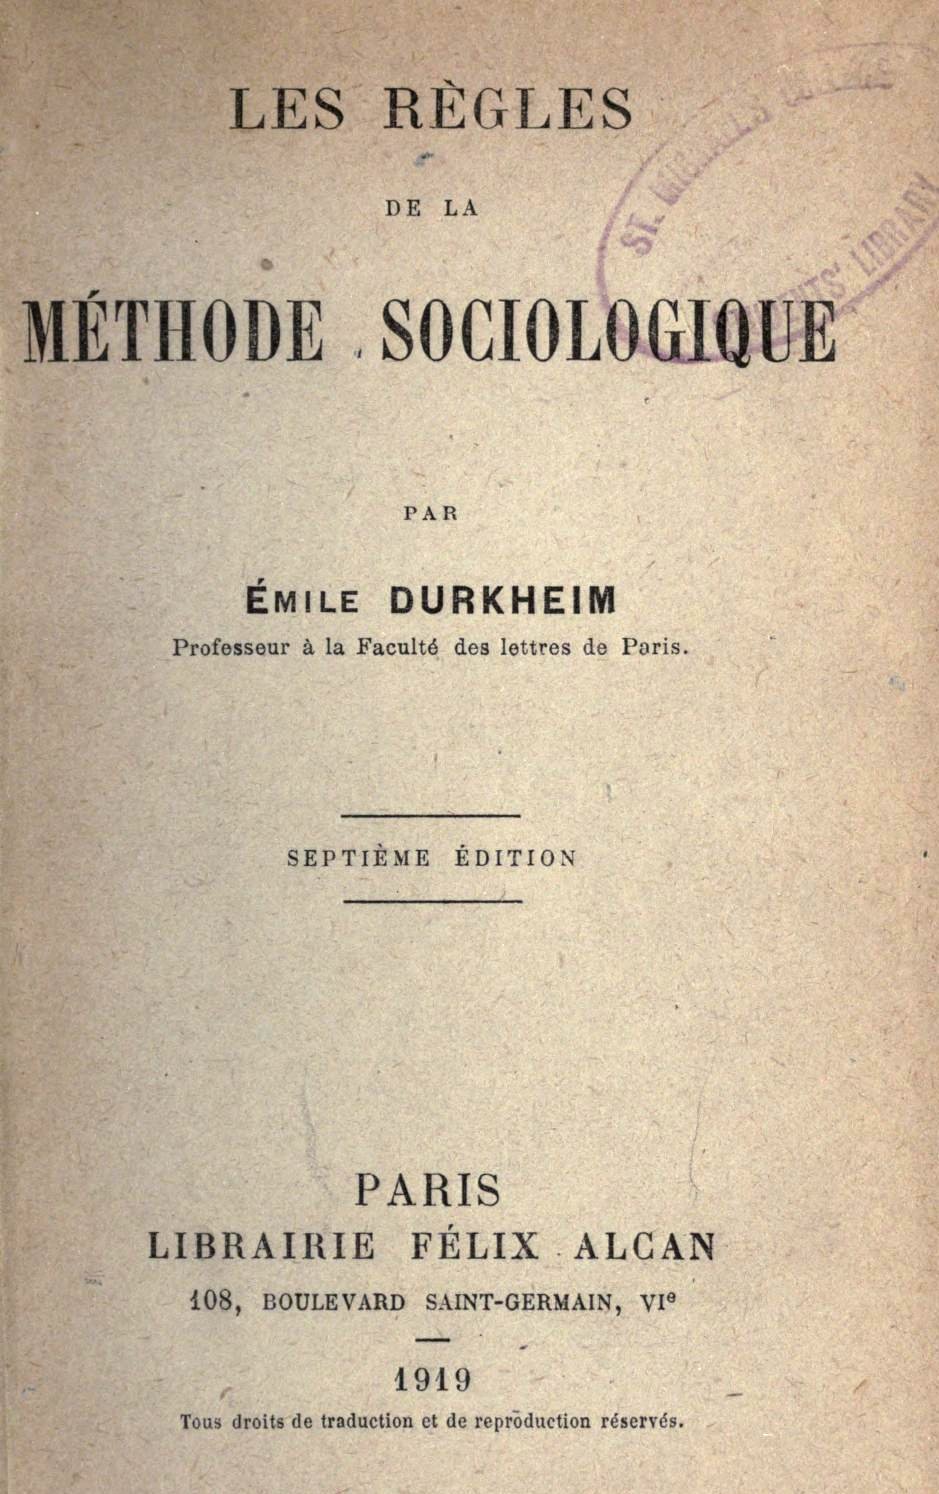
The Rules of Sociological Method
Émile Durkheim · 1895
 Book
Primary source
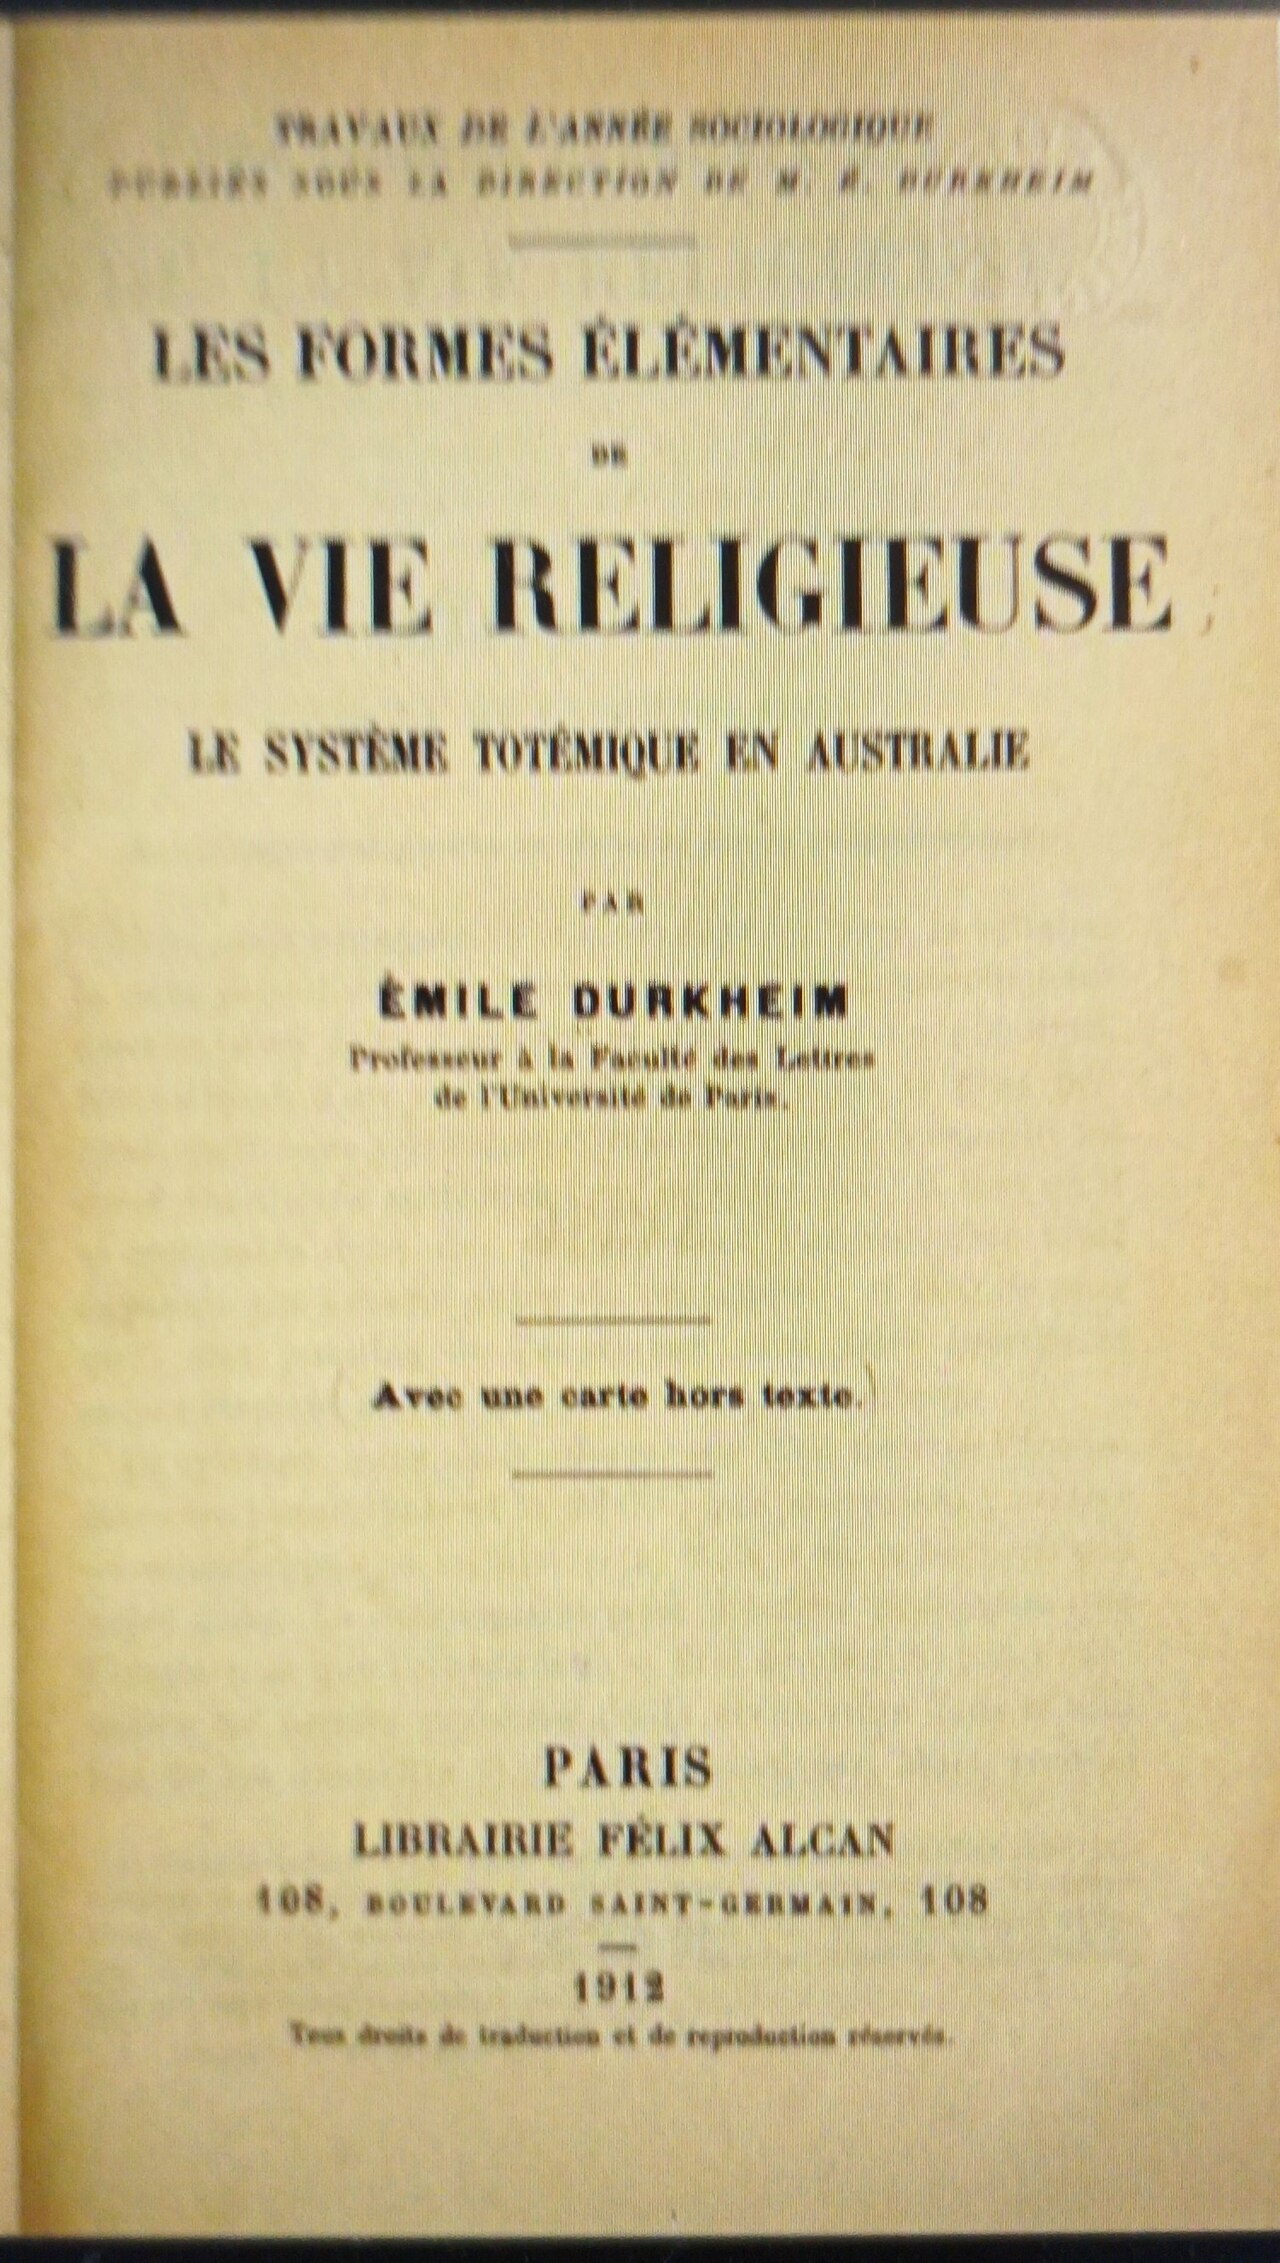
The Elementary Forms of the Religious Life
Émile Durkheim · 1912
Free account
Read every Emile Durkheim source
Sign up free →
Ready when you are
Start chatting with Emile Durkheim now.
20 messages free · No credit card · Available in 50+ languages.