


Primary sourceDocument1897
Suicide and Wealth Map
Émile Durkheim · 1897
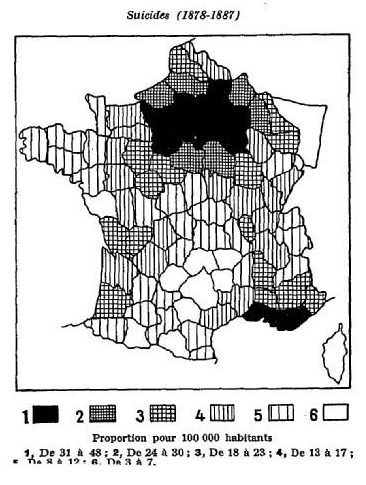
A statistical map from Durkheim's Suicide linking suicide rates to wealth across France.
Durkheim produced this map as part of his data-based argument linking wealth to suicide rates.
About this source
What it is
Made by Émile Durkheim for his study Le Suicide, this map shades French regions by suicide rate per 100,000 people from 1878 to 1887, comparing the figures to regional wealth.
Why it matters
Durkheim argued that rapid economic change and prosperity could weaken the rules that normally regulate people's lives, producing what he called "anomic suicide." This map was part of his evidence that wealthier, less regulated regions had different suicide patterns.
Look closer
- Why does the map highlight areas like Paris and Marseille as having high rates?
- How might wealth and social regulation be connected, according to Durkheim's theory?
- What other factors besides wealth could explain the patterns shown here?
This document is part of the curated material that grounds the AI version of Emile Durkheim on Humy.ai — when students ask about related events, the AI can quote it and cite it.
More Emile Durkheim sources
Browse all 59 → Book
Primary source
Suicide
Émile Durkheim · 1897
 Book
Primary source
The Division of Labour in Society
Émile Durkheim · 1893
 Book
Primary source
The Rules of Sociological Method
Émile Durkheim · 1895
 Book
Primary source
The Elementary Forms of the Religious Life
Émile Durkheim · 1912


Free account
Read every Emile Durkheim source
Sign up free →
Ready when you are
Start chatting with Emile Durkheim now.
20 messages free · No credit card · Available in 50+ languages.