


Primary sourceDocument1912
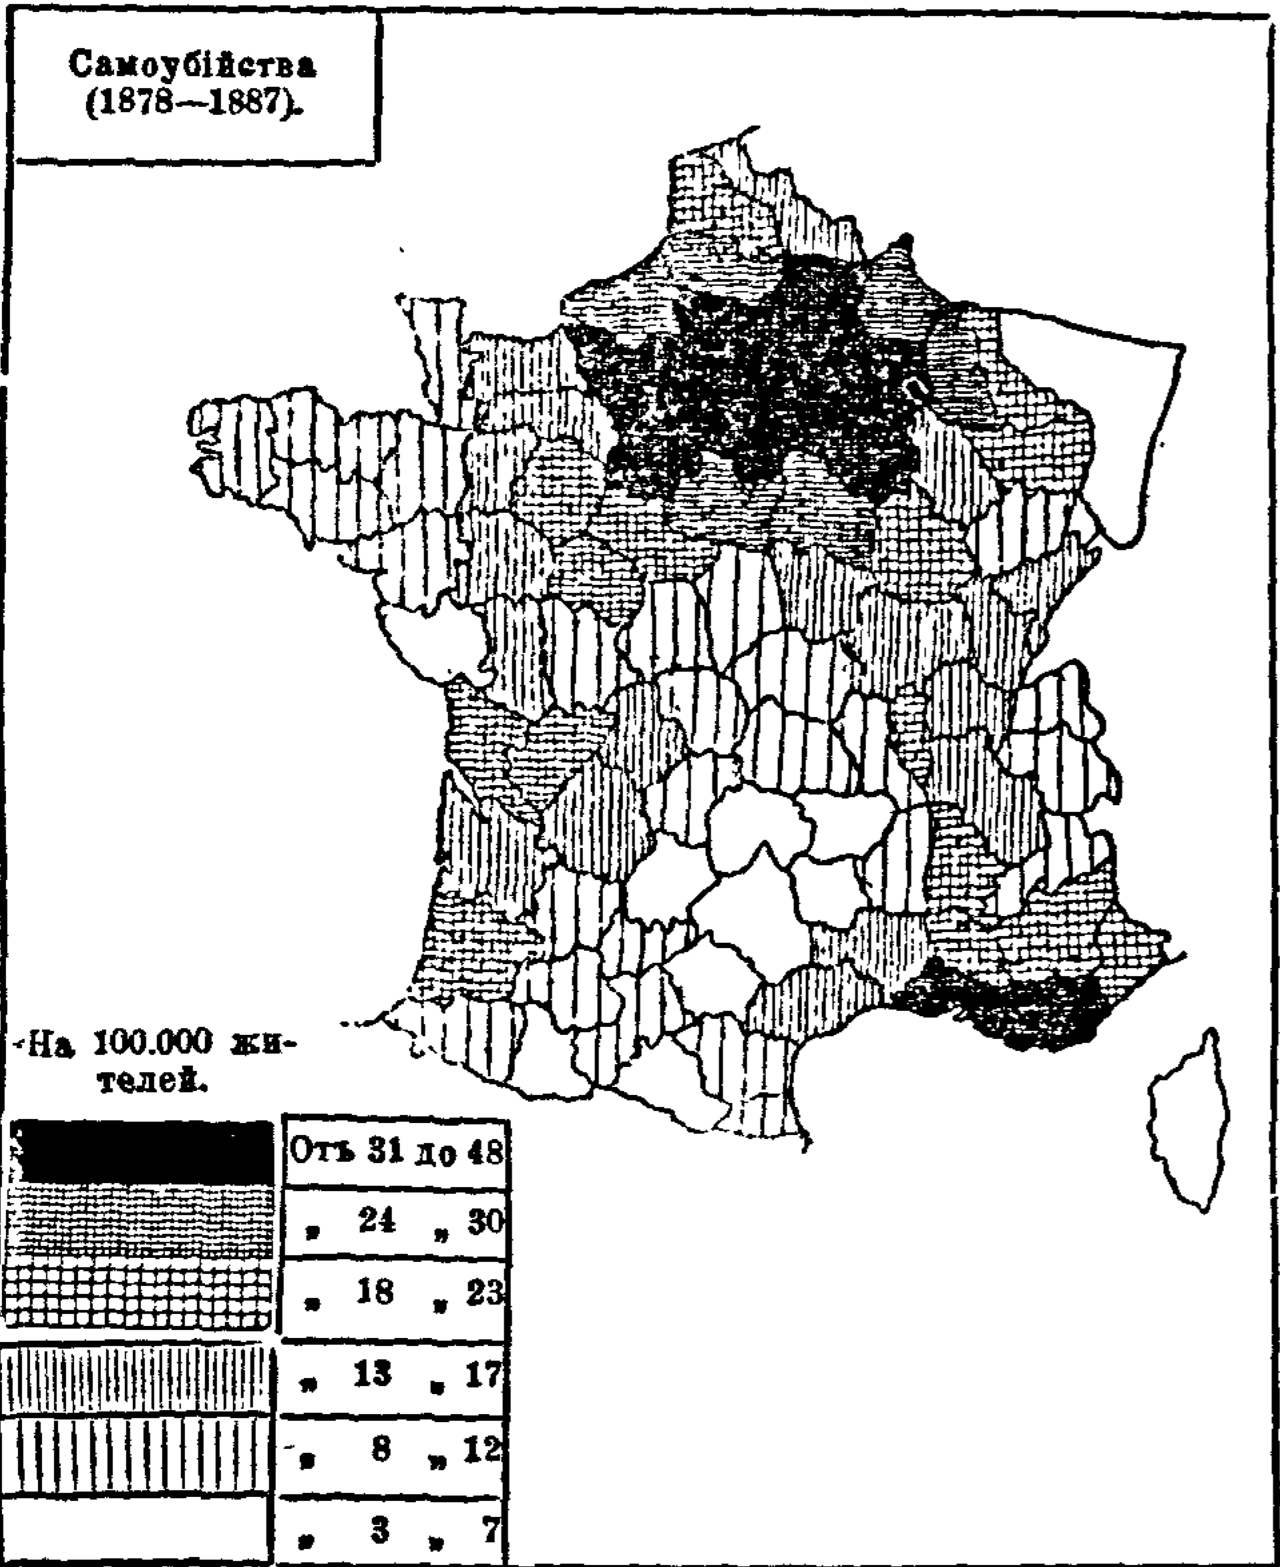
Suicide, Russian Edition, Chart 1-1
Émile Durkheim · 1912
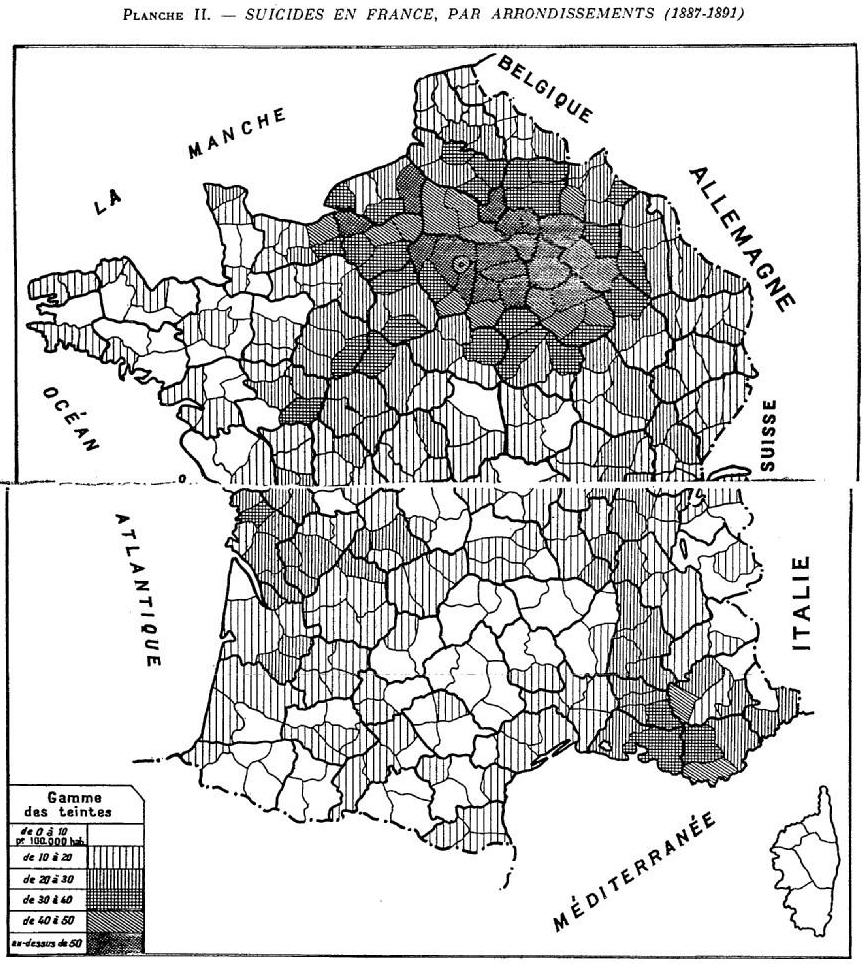
A map of France showing suicide rates by department, from the 1912 Russian edition of Durkheim's famous book Suicide.
This chart comes directly from a Russian edition of Durkheim's own book Suicide, illustrating his statistical method.
About this source
What it is
This is a chart from the 1912 St Petersburg Russian edition of Durkheim's book Suicide. It is a shaded map of France showing suicide rates by department between 1878 and 1887, with darker shading marking higher rates.
Why it matters
Durkheim's Suicide was a landmark work of sociology, arguing that even something as personal as suicide follows social patterns that can be studied scientifically. This map is part of the evidence he used to show regional differences in suicide rates across France.
Look closer
- Which parts of France have the darkest shading, and what might explain this pattern?
- Why would a sociologist choose to present data as a map rather than a list of numbers?
- What historical or social information is missing from a map like this?
This document is part of the curated material that grounds the AI version of Emile Durkheim on Humy.ai — when students ask about related events, the AI can quote it and cite it.
More Emile Durkheim sources
Browse all 59 → Book
Primary source
Suicide
Émile Durkheim · 1897
 Book
Primary source
The Division of Labour in Society
Émile Durkheim · 1893
 Book
Primary source
The Rules of Sociological Method
Émile Durkheim · 1895
 Book
Primary source
The Elementary Forms of the Religious Life
Émile Durkheim · 1912

Free account
Read every Emile Durkheim source
Sign up free →
Ready when you are
Start chatting with Emile Durkheim now.
20 messages free · No credit card · Available in 50+ languages.