


Primary sourceDocument1912
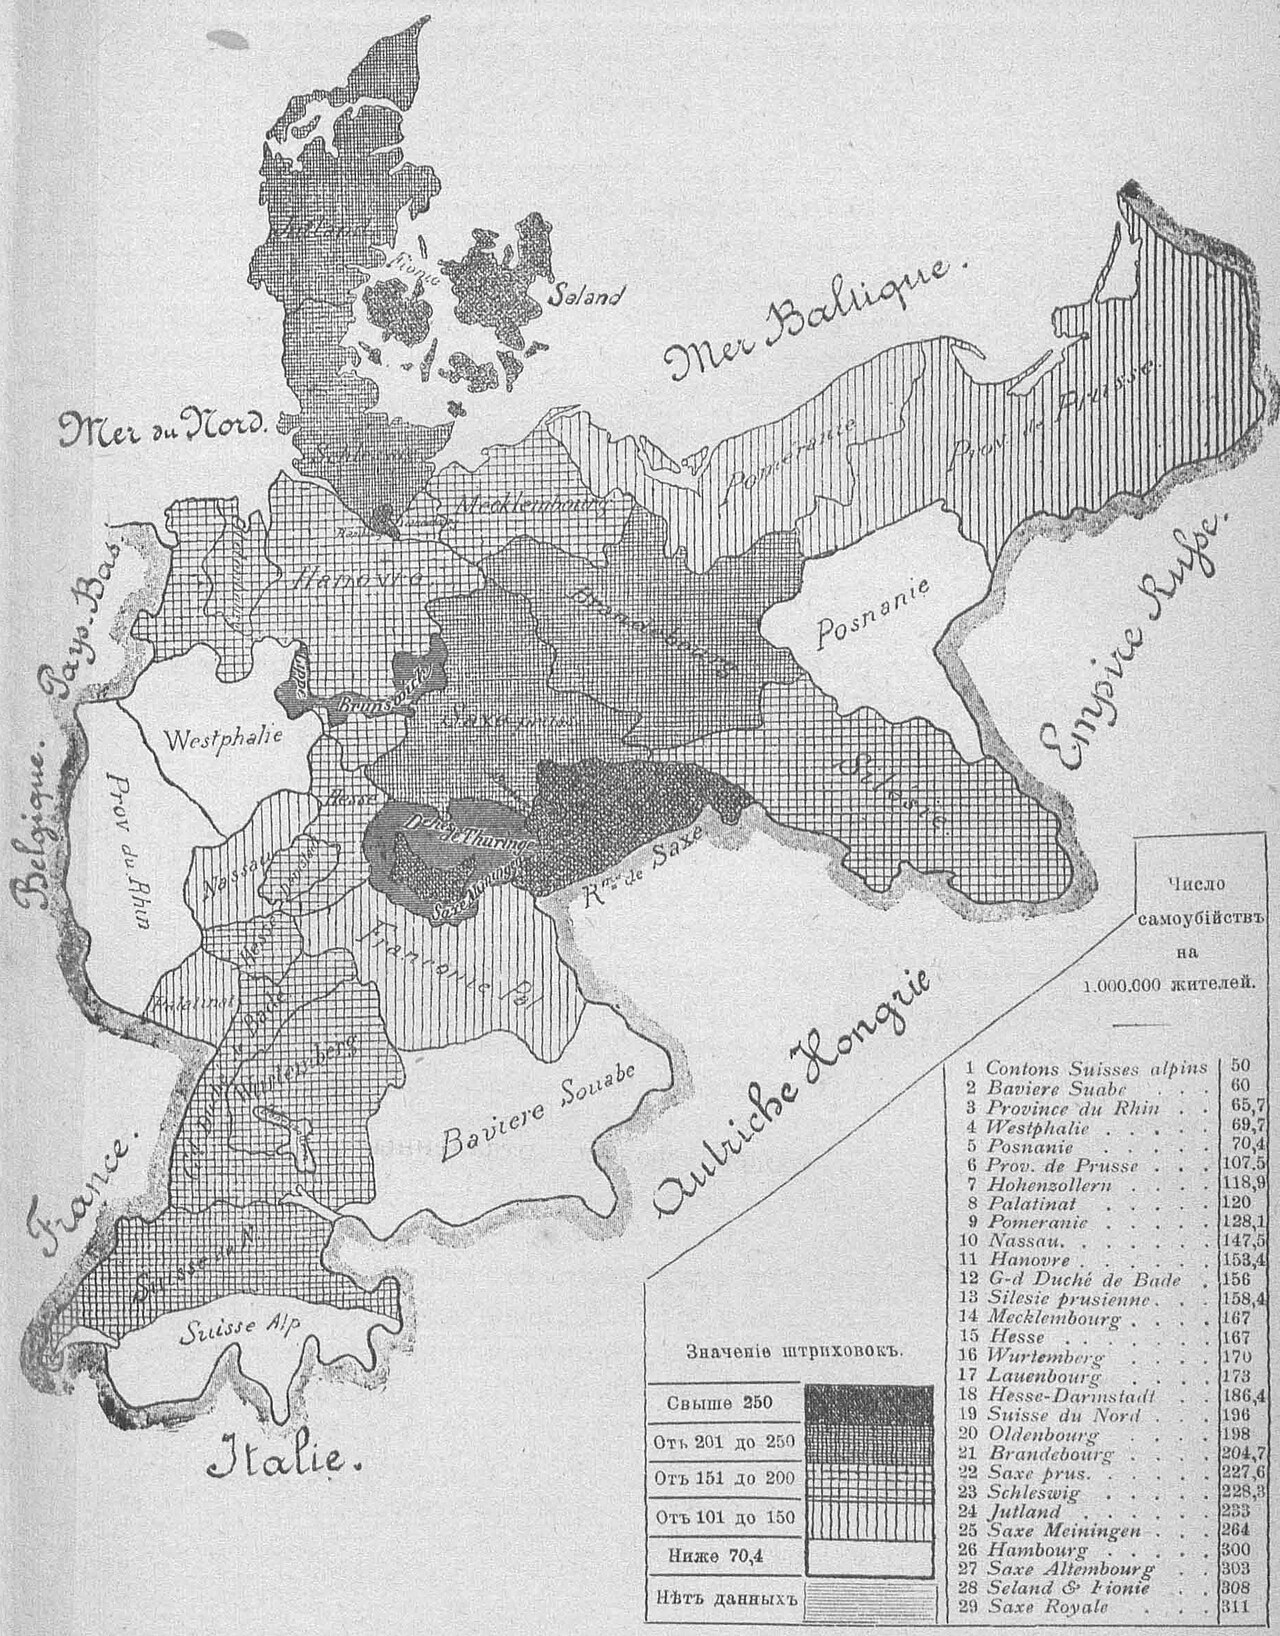
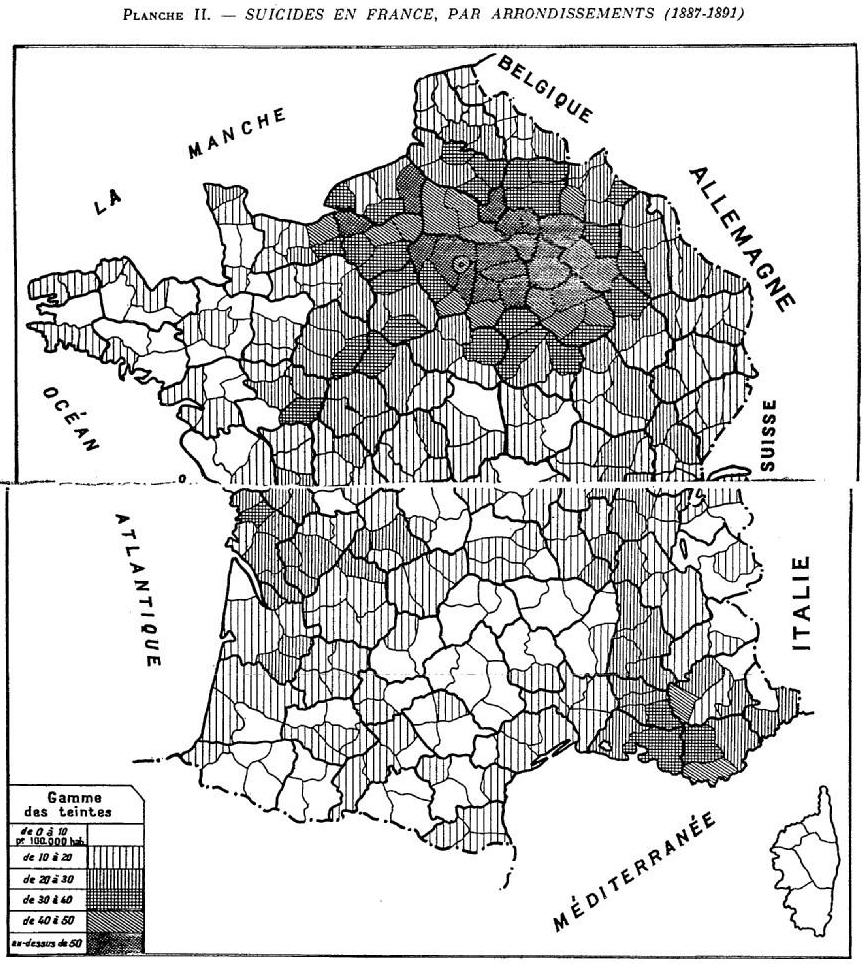
Suicides in Central Europe after Morselli
Unknown author · 1912
A choropleth map showing suicide rates across Central and Northern Europe, drawn from Morselli's statistics and used in a Russian edition of Durkheim's work.
This map, based on Morselli's data, was used in a Russian edition of Durkheim's famous study of suicide.
Free Humy account · No credit card · 120,912 sources to read
About this source
What it is
This is a shaded map showing suicide rates per million inhabitants across regions of Central and Northern Europe. It uses statistics gathered by the Italian scholar Morselli and appeared in a 1912 Russian edition connected to Durkheim's study of suicide.
Why it matters
Durkheim used maps like this to argue that suicide was not just a personal act but a social fact, shaped by patterns that could be measured across whole regions. This map shows how statistics and geography were combined to support sociological arguments in the early 20th century.
Look closer
- What does the shading tell you about which regions had higher or lower suicide rates?
- Why might a sociologist use a map instead of just numbers in a table?
- What questions does this map not answer about why people in different regions might have different rates?
This document is part of the curated material that grounds the AI version of Emile Durkheim on Humy.ai — when students ask about related events, the AI can quote it and cite it.
More Emile Durkheim sources
Browse all 59 →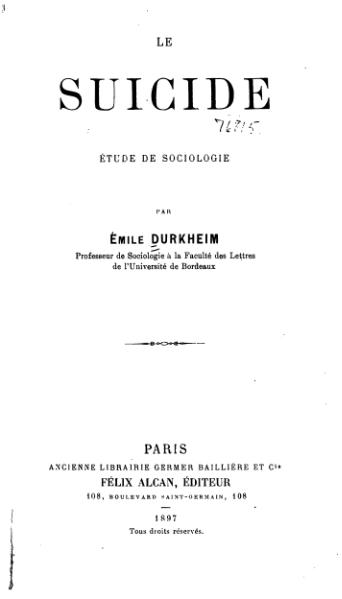 Book
Primary source
Suicide
Émile Durkheim · 1897
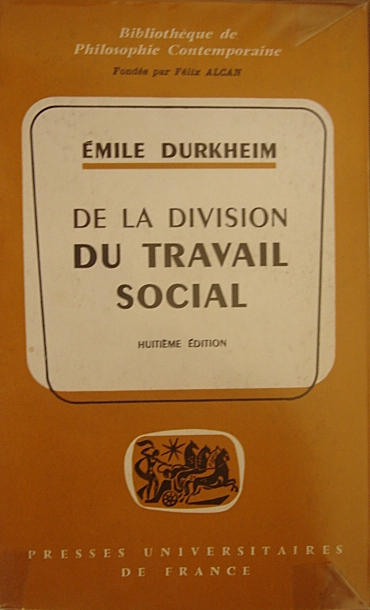 Book
Primary source
The Division of Labour in Society
Émile Durkheim · 1893
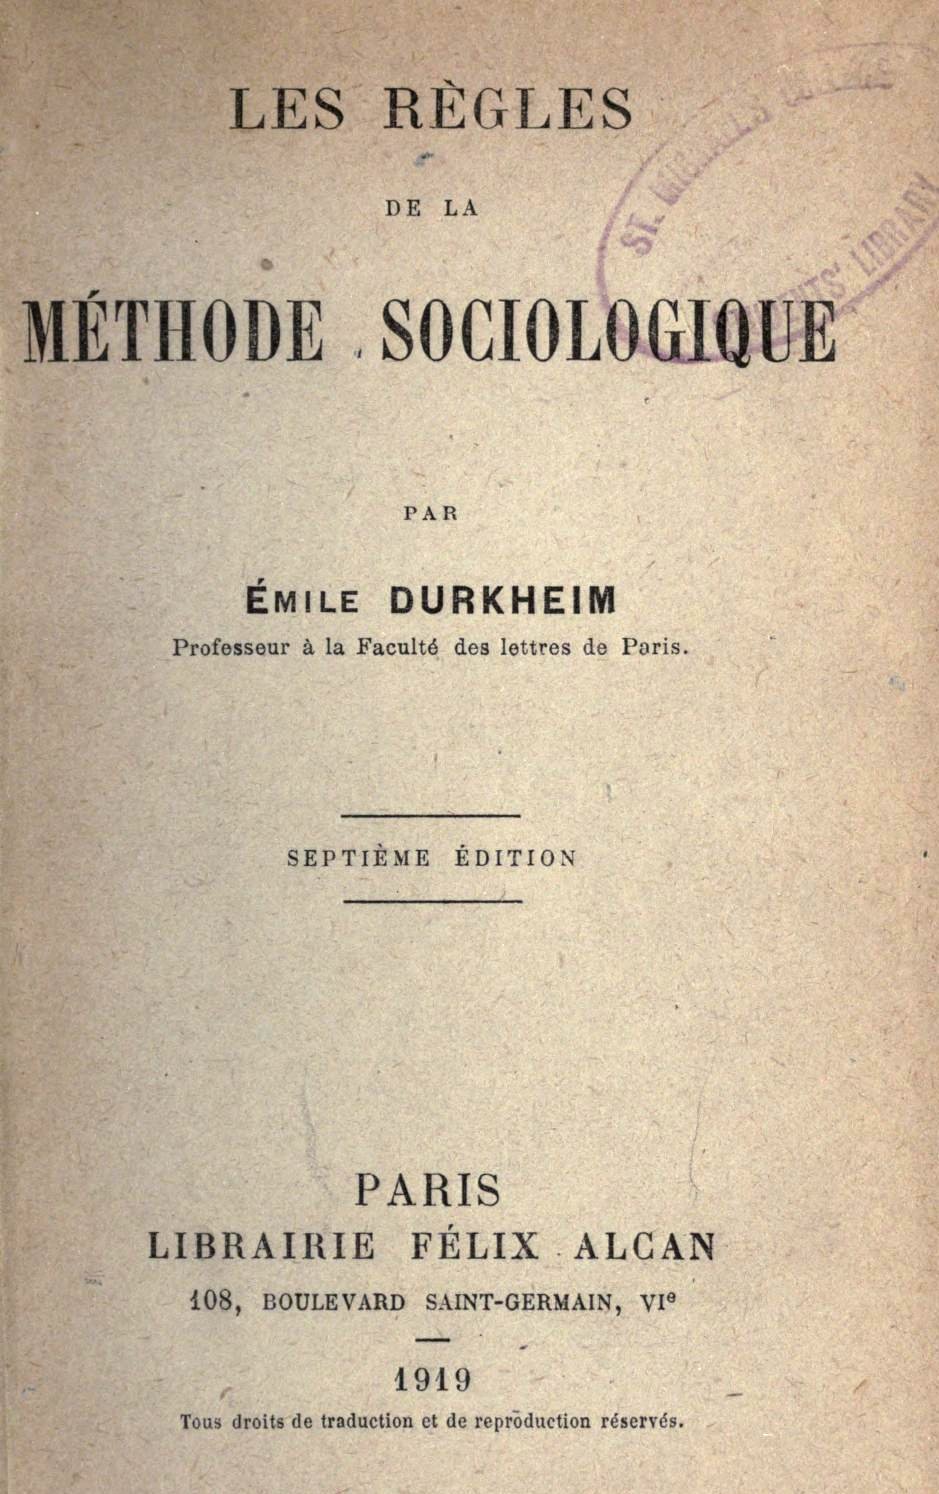 Book
Primary source
The Rules of Sociological Method
Émile Durkheim · 1895
 Book
Primary source
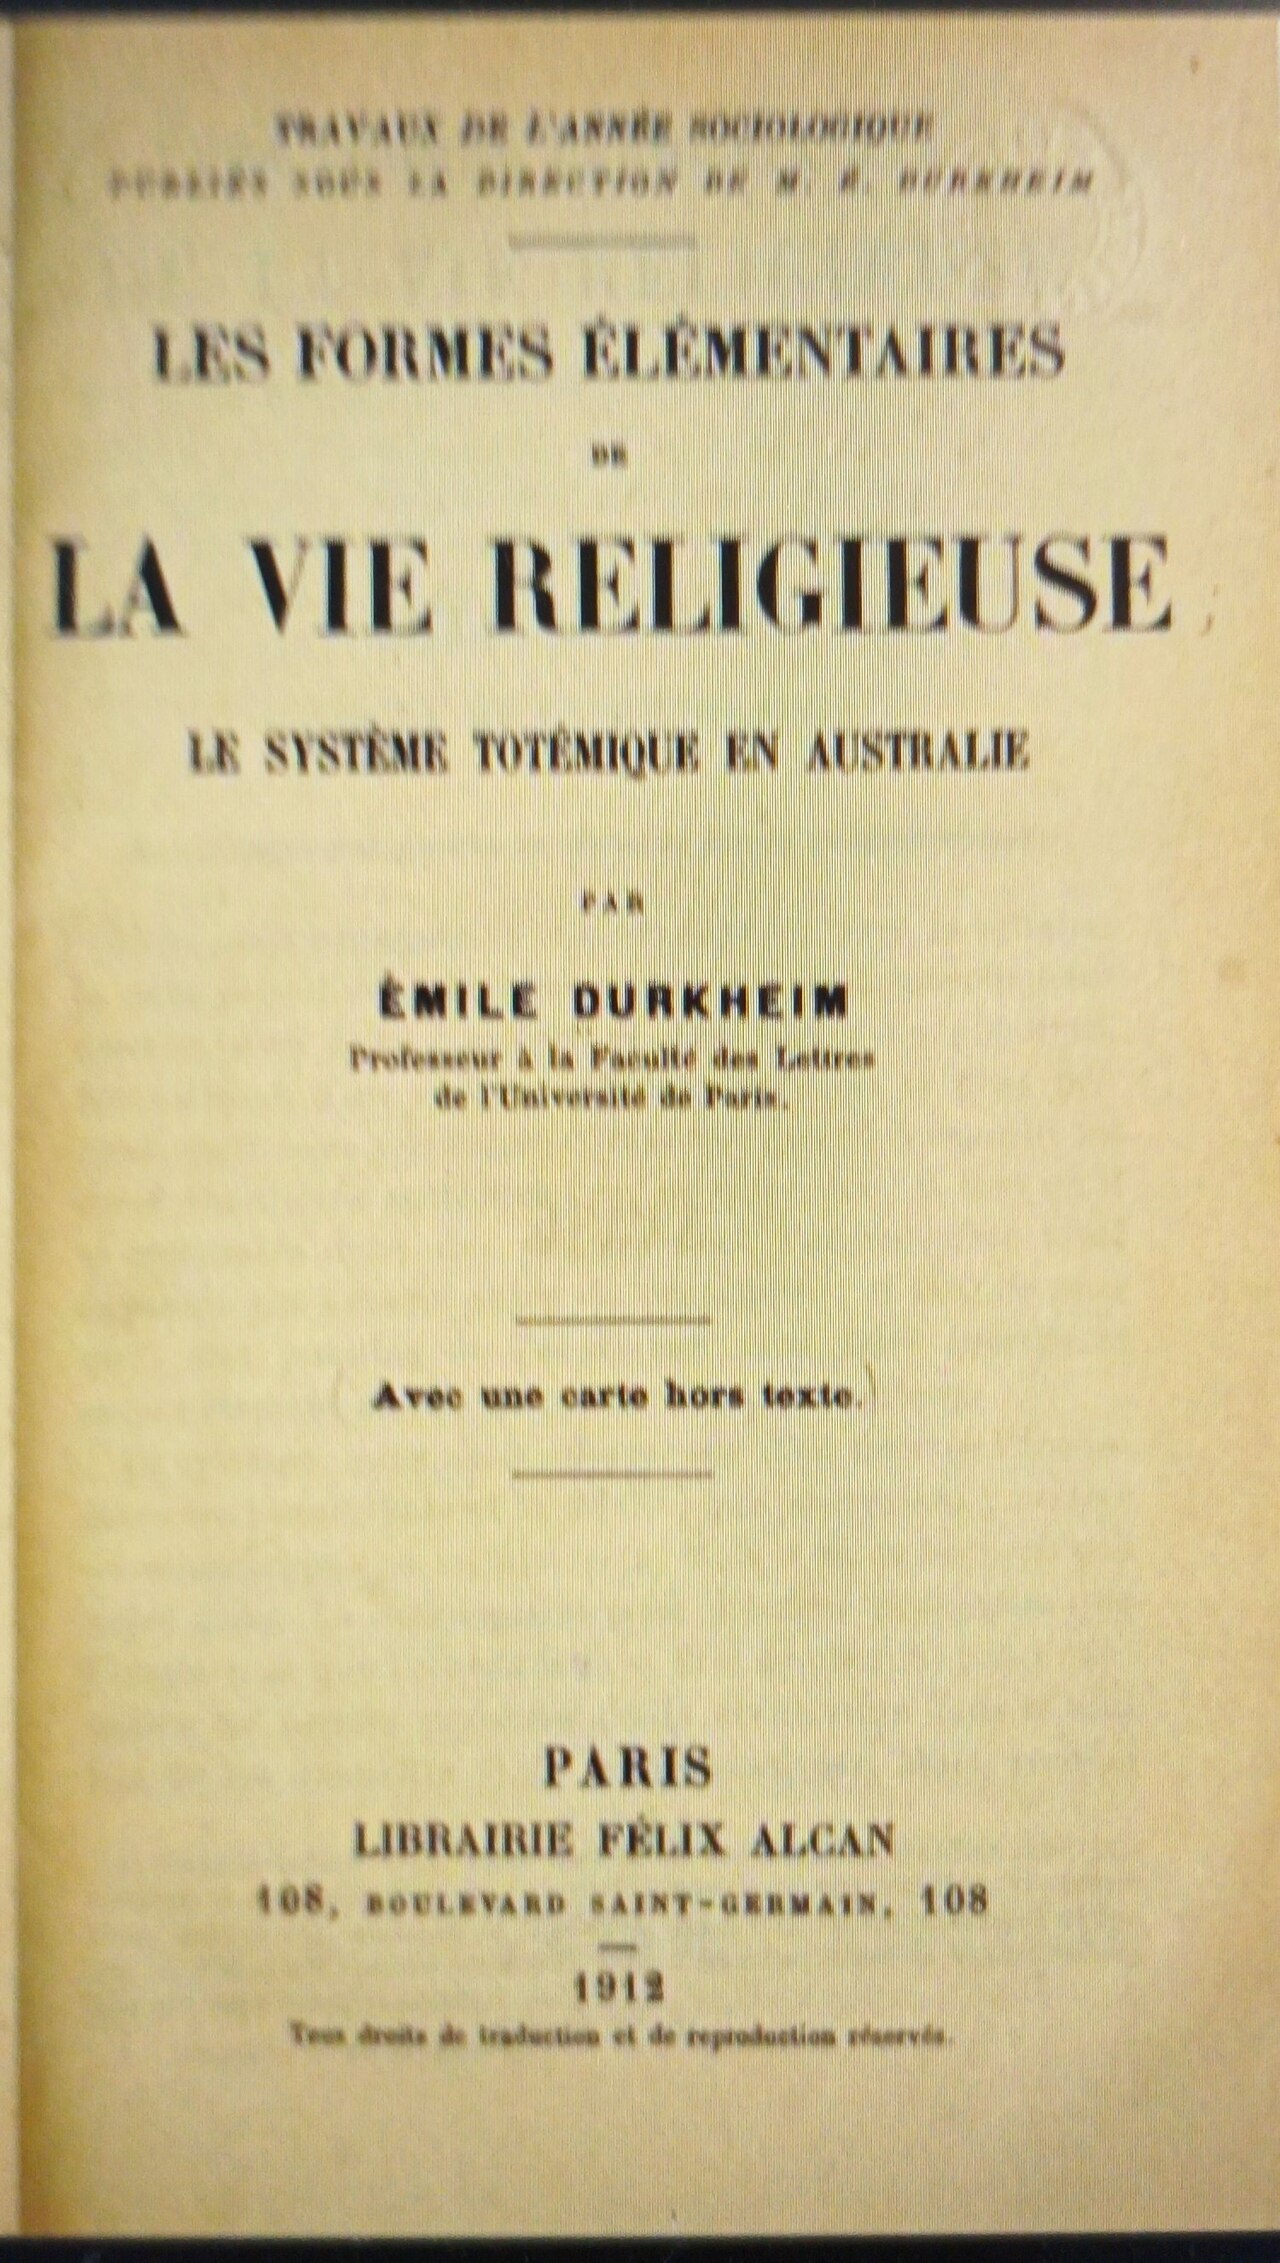
The Elementary Forms of the Religious Life
Émile Durkheim · 1912
Free account
Read every Emile Durkheim source
Sign up free →
Ready when you are
Start chatting with Emile Durkheim now.
20 messages free · No credit card · Available in 50+ languages.