


Secondary sourceArtifact2010
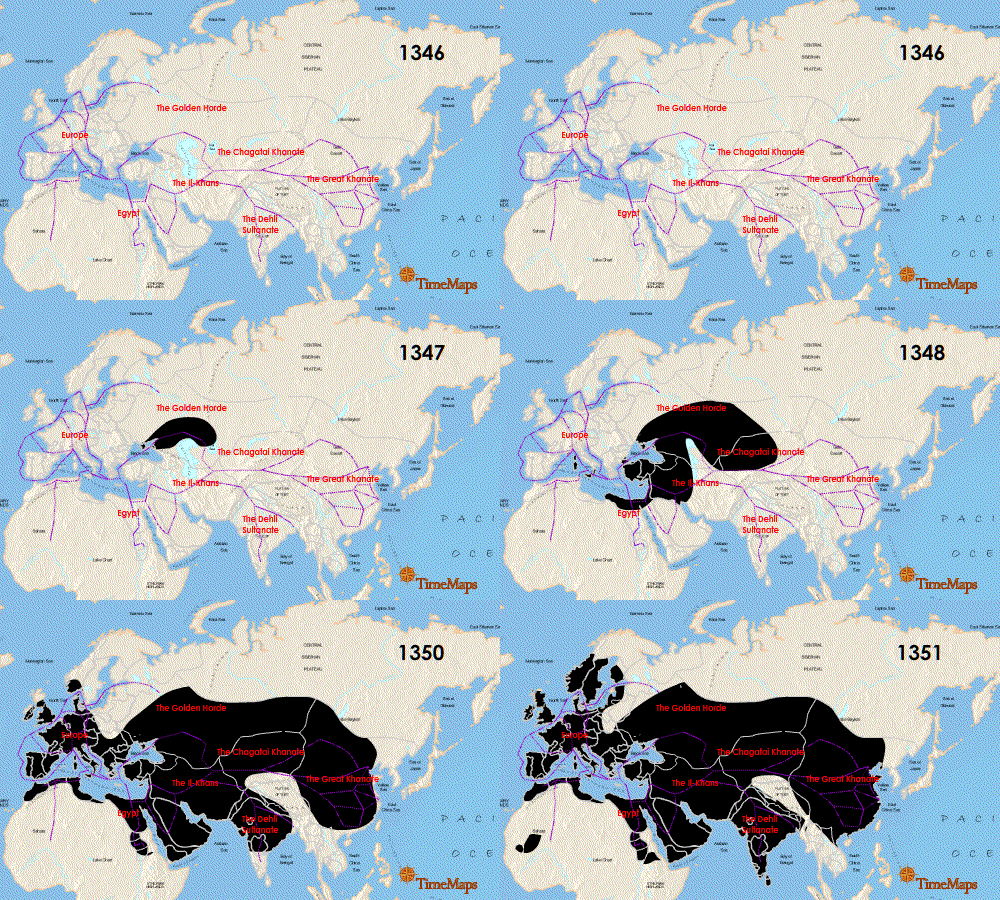
Animation Showing the Spread of the Black Death, 1346-1351
Timemaps · 2010
An animated map tracing the year-by-year spread of the Black Death across Eurasia and North Africa from 1346 to 1351.
A modern visualization tracing exactly how the pandemic spread across continents.
About this source
What it is
This is a modern animated map created by Timemaps, uploaded in 2010, showing the spread of the Black Death from 1346 to 1351. The frame shown here marks the year 1346, with routes traced across regions including the Golden Horde, Europe, the Chagatai Khanate, the Il-Khans, Egypt, the Delhi Sultanate, and the Great Khanate.
Why it matters
The Black Death spread along trade and travel routes connecting much of Eurasia and North Africa, affecting enormous numbers of people across many different societies. This modern animation helps visualize how interconnected these regions were and how quickly disease could move between them.
Look closer
- What does the map suggest about how connected different parts of the world were in the 1300s?
- Why might tracing the spread of disease along trade routes help explain how far and fast it traveled?
- What is missing from a map like this that a written account might show instead?
This artifact is part of the curated material that grounds the AI version of The Black Death on Humy.ai — when students ask about related events, the AI can quote it and cite it.
More The Black Death sources
Meet the AI The Black Death →Secondary source
The Decameron
Giovanni Boccaccio · 1351
Primary source
Statute of Labourers 1351
1351
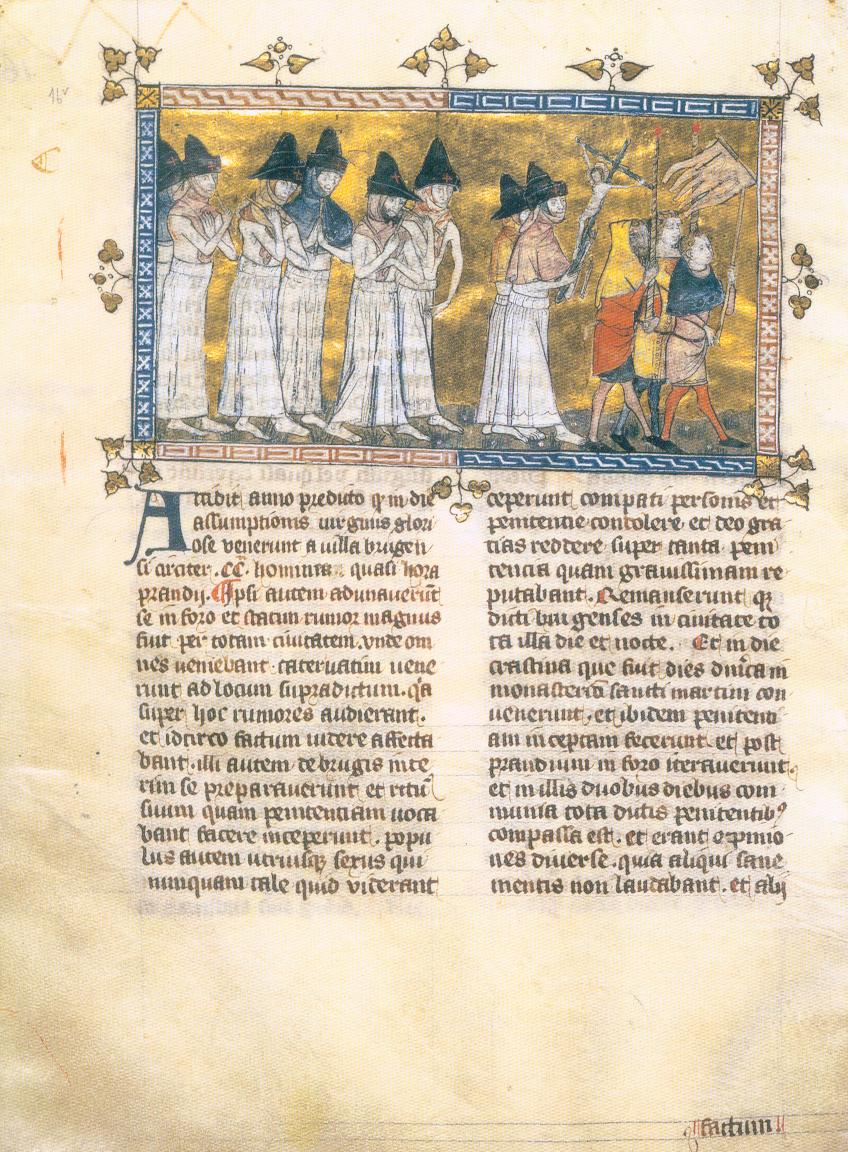 Painting
Primary source
Depiction of the Flagellant Processions
Pierart dou Tielt · c. 1350
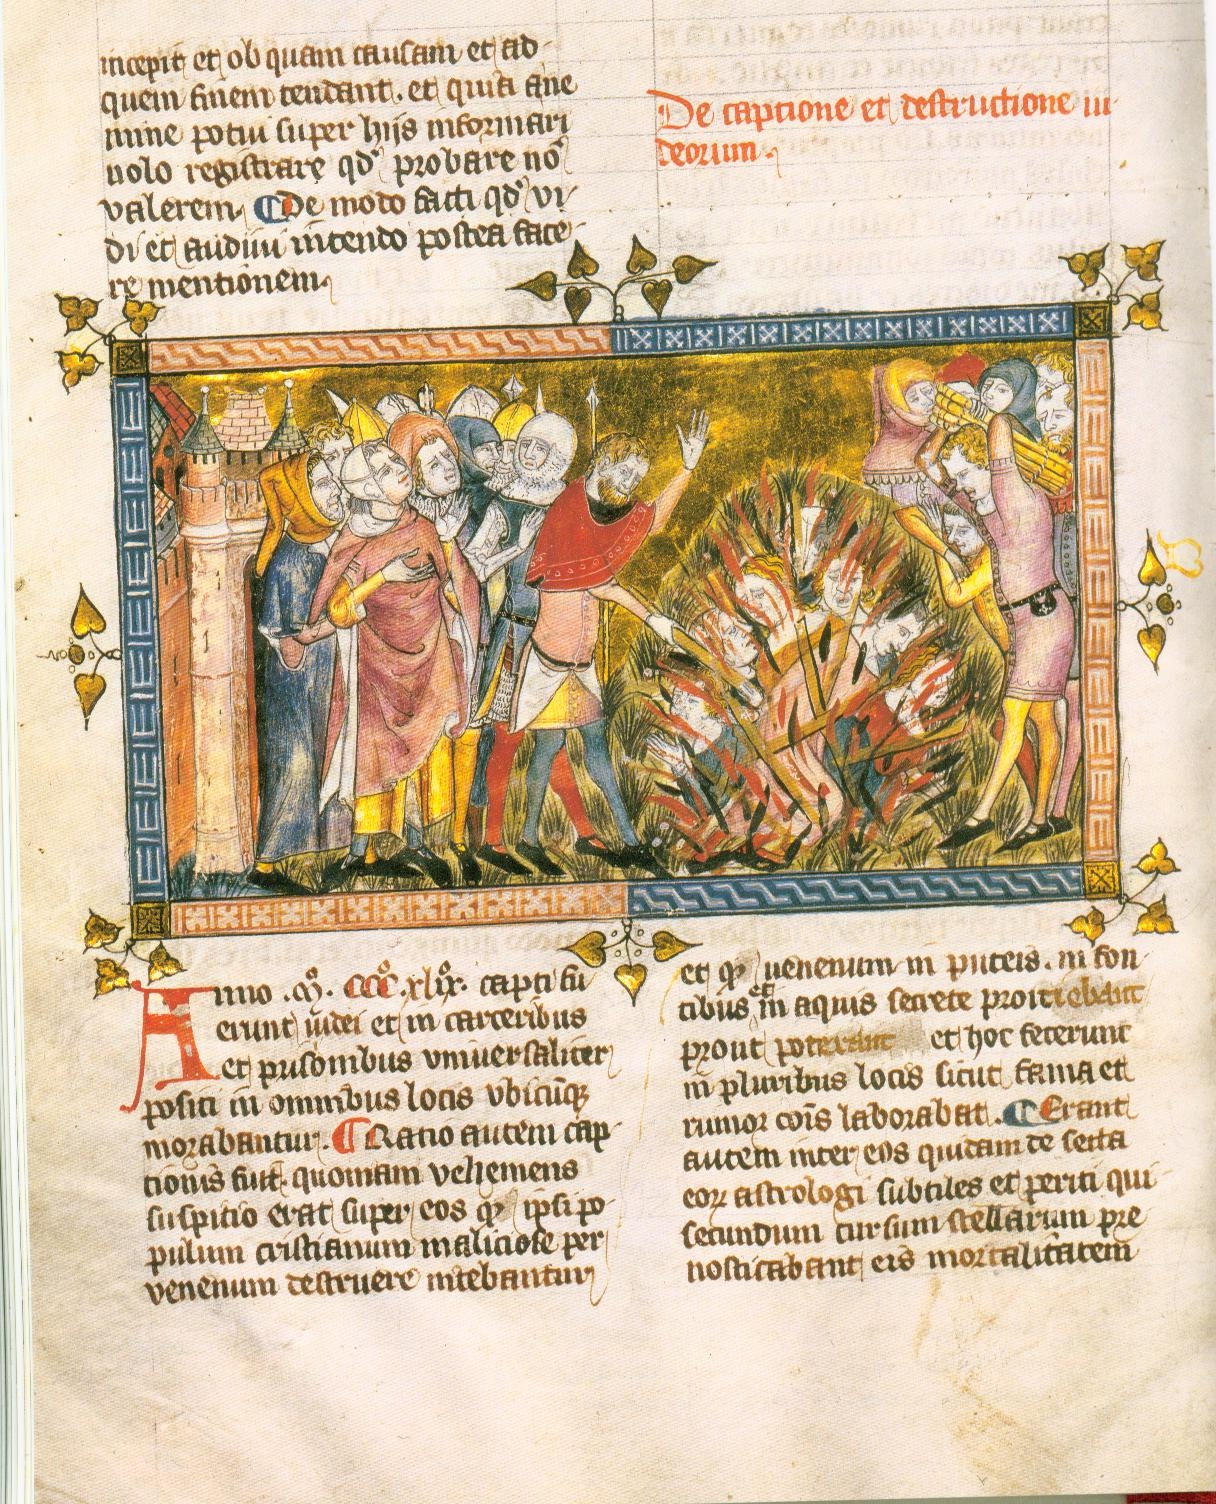 Painting
Primary source
Execution of Jews
c. 1350
 Book
Primary source
The Annals of Ireland by Friar John Clyn
John Clyn · 1348-1349
Ready when you are
Start chatting with The Black Death now.
20 messages free · No credit card · Available in 50+ languages.