


Secondary sourceDocument25 April 2023
Black Death spread in Europe map, Basque version
Roger Zenner · 25 April 2023
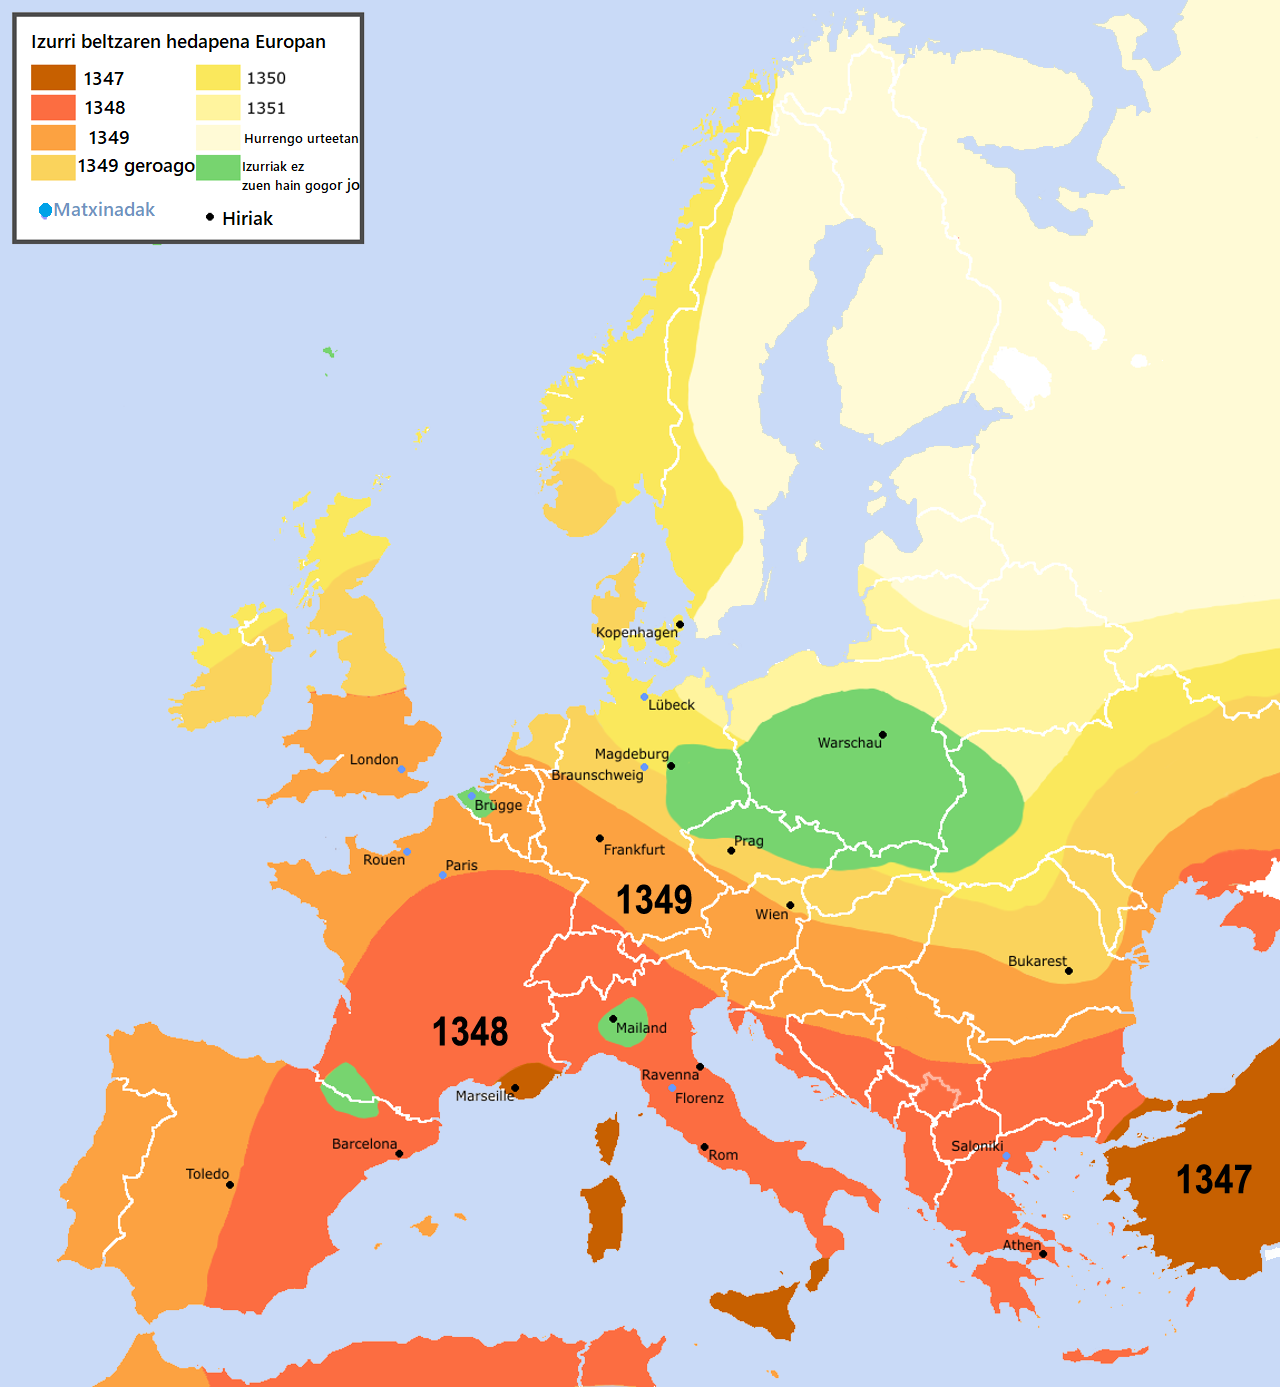
A modern map in Basque showing how the Black Death moved across Europe from 1347 to 1351. It is a translated edition of an existing map.
This modern map shows the spread of the Black Death, the 1346–1353 pandemic, across Europe, and it fits the archive as a teaching aid rather than a source from the period.
About this source
What it is
This is a map of Europe showing the spread of the Black Death from 1347 to 1351, with colored zones for each year. Its legend is in Basque, and its title reads "Eskema - Nola hedatu zen Izurri Beltza Europan". The original map was made by Roger Zenner, and user Jaybear enlarged it and edited it for readability. The file is dated 25 April 2023. Because it is a translated edition, it is not an artifact from the 14th century.
Why it matters
The map helps students see the pattern of the pandemic, which moved from Turkey, the Black Sea area and Sicily toward the northwest. Labeled cities such as London, Paris, Prague, Vienna and Athens show where the disease reached. The map is a modern summary built from historical knowledge, so it shows how historians today understand the spread. It does not show the people who lived through it.
Look closer
- Which years are shown by the colored zones, and how do the zones change over time?
- Why might a modern mapmaker choose to show the spread with colors and dots?
- What does the map leave out, such as local details, death tolls, or the people who lived through the outbreak?
This document is part of the curated material that grounds the AI version of The Black Death on Humy.ai — when students ask about related events, the AI can quote it and cite it.
More The Black Death sources
Meet the AI The Black Death →Secondary source
The Decameron
Giovanni Boccaccio · 1351
Primary source
Statute of Labourers 1351
1351
 Painting
Primary source
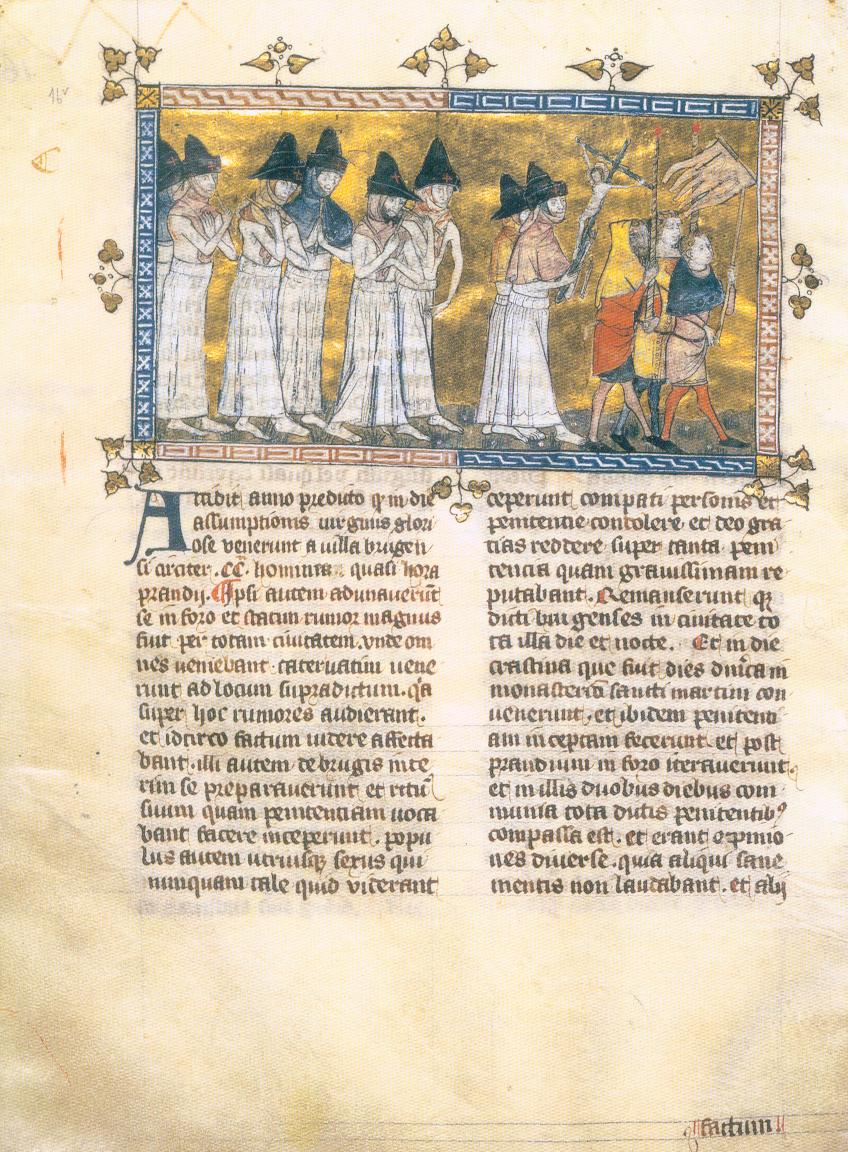
Depiction of the Flagellant Processions
Pierart dou Tielt · c. 1350
 Painting
Primary source
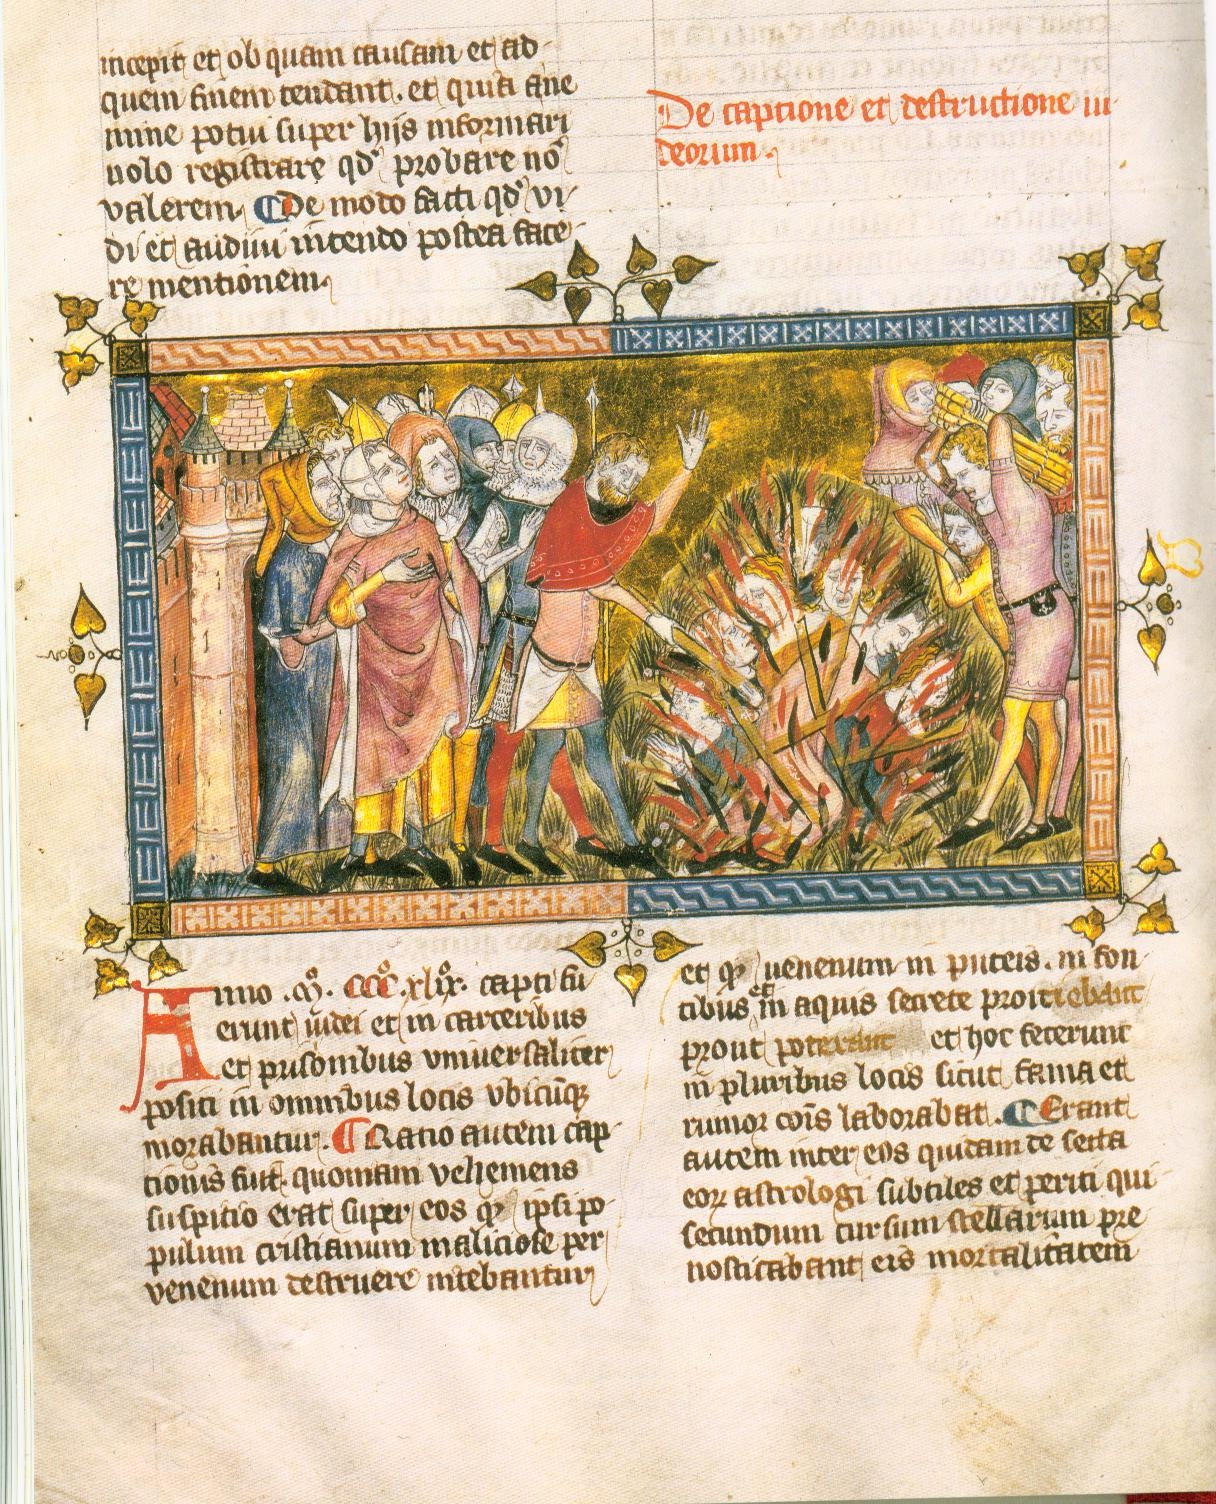
Execution of Jews
c. 1350
 Book
Primary source
The Annals of Ireland by Friar John Clyn
John Clyn · 1348-1349
Ready when you are
Start chatting with The Black Death now.
20 messages free · No credit card · Available in 50+ languages.