


Primary sourcePainting1913
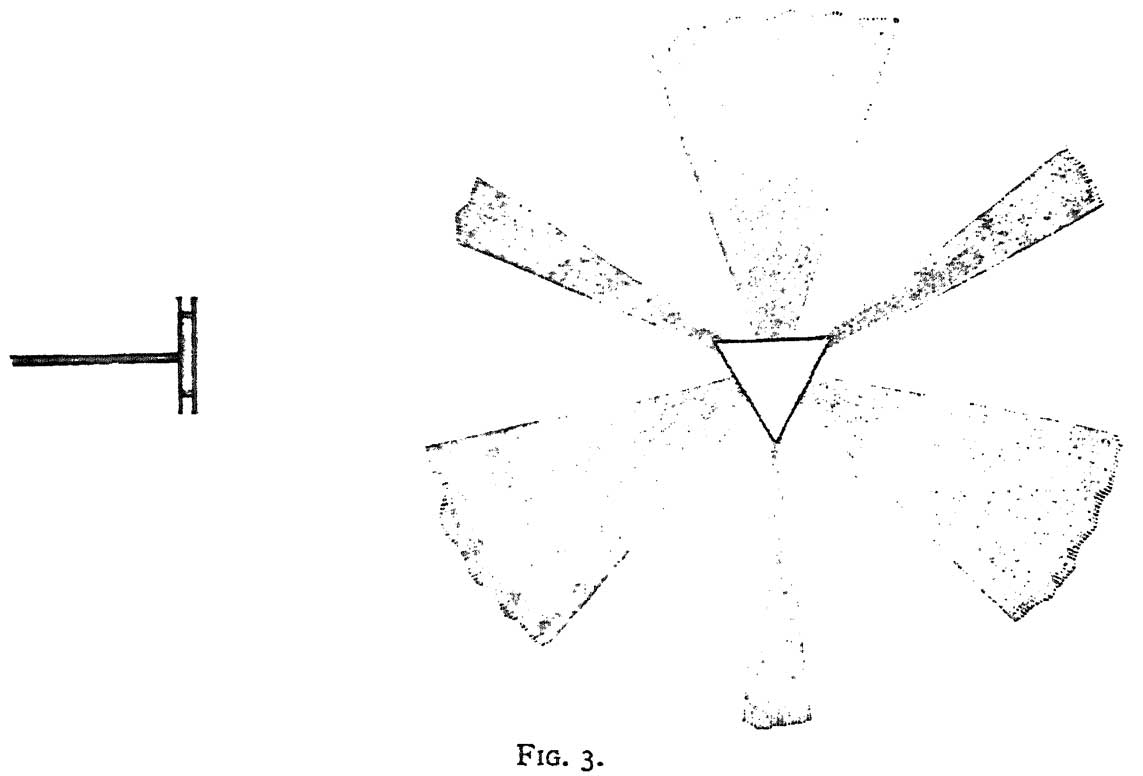
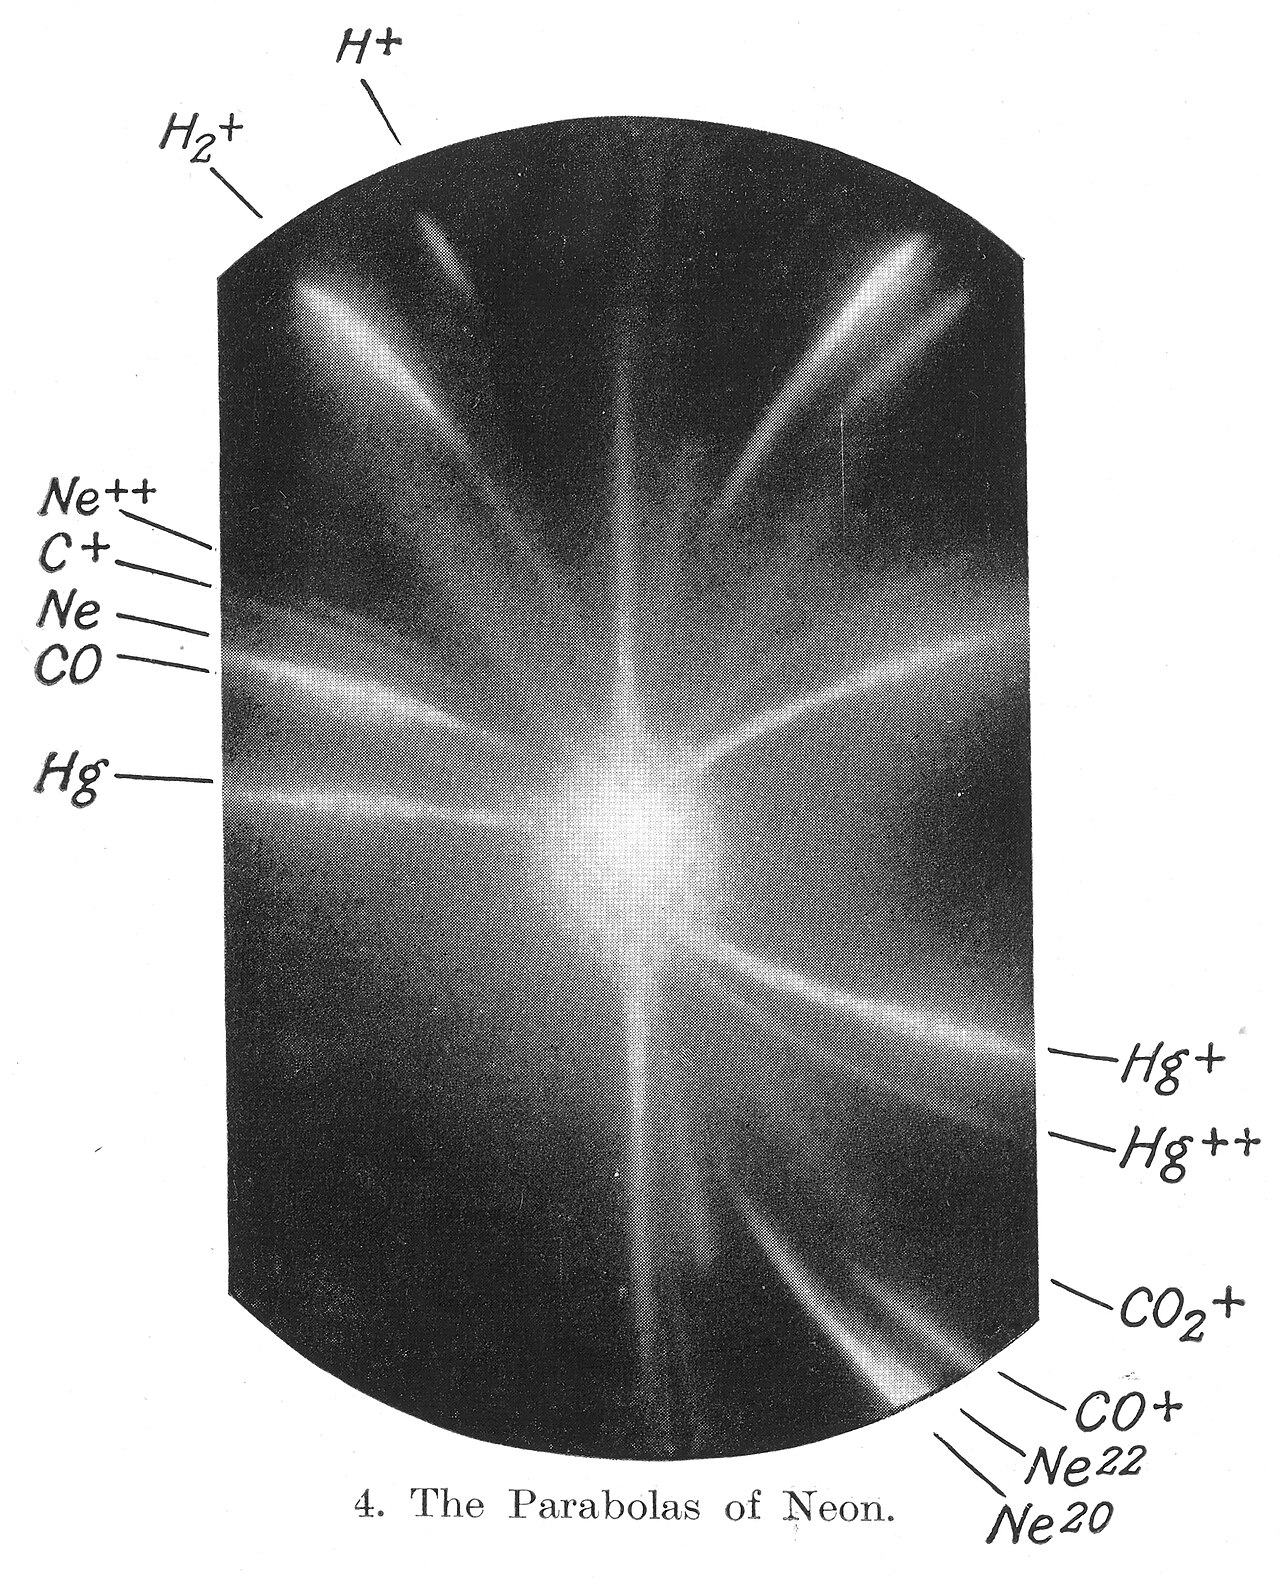
Positive Ray Parabola Diagram
J. J. Thomson · 1913
A diagram from Thomson's 1913 book showing positive-ray traces, part of the method that led to mass spectrometry.
This figure from Thomson's 1913 book illustrates the technique he developed for analysing positive rays.
About this source
What it is
This is a figure from Rays of Positive Electricity and their Application to Chemical Analyses, a 1913 book by J. J. Thomson. It shows a small T-shaped apparatus and, beside it, fan-shaped parabola-like streaks produced by positive rays.
Why it matters
This diagram illustrates the technique Thomson developed to analyse rays of positively charged particles by deflecting them with electric and magnetic fields. The parabola patterns recorded different masses, and this method became the basis for what later grew into mass spectrometry, a tool still used across science today.
Look closer
- What might the different streaks in the fan-shaped pattern represent?
- Why would recording the shapes of these traces be useful for identifying different particles?
- What does this diagram not show about how the original apparatus actually worked?
This painting is part of the curated material that grounds the AI version of J. J. Thomson on Humy.ai — when students ask about related events, the AI can quote it and cite it.
More J. J. Thomson sources
Browse all 55 →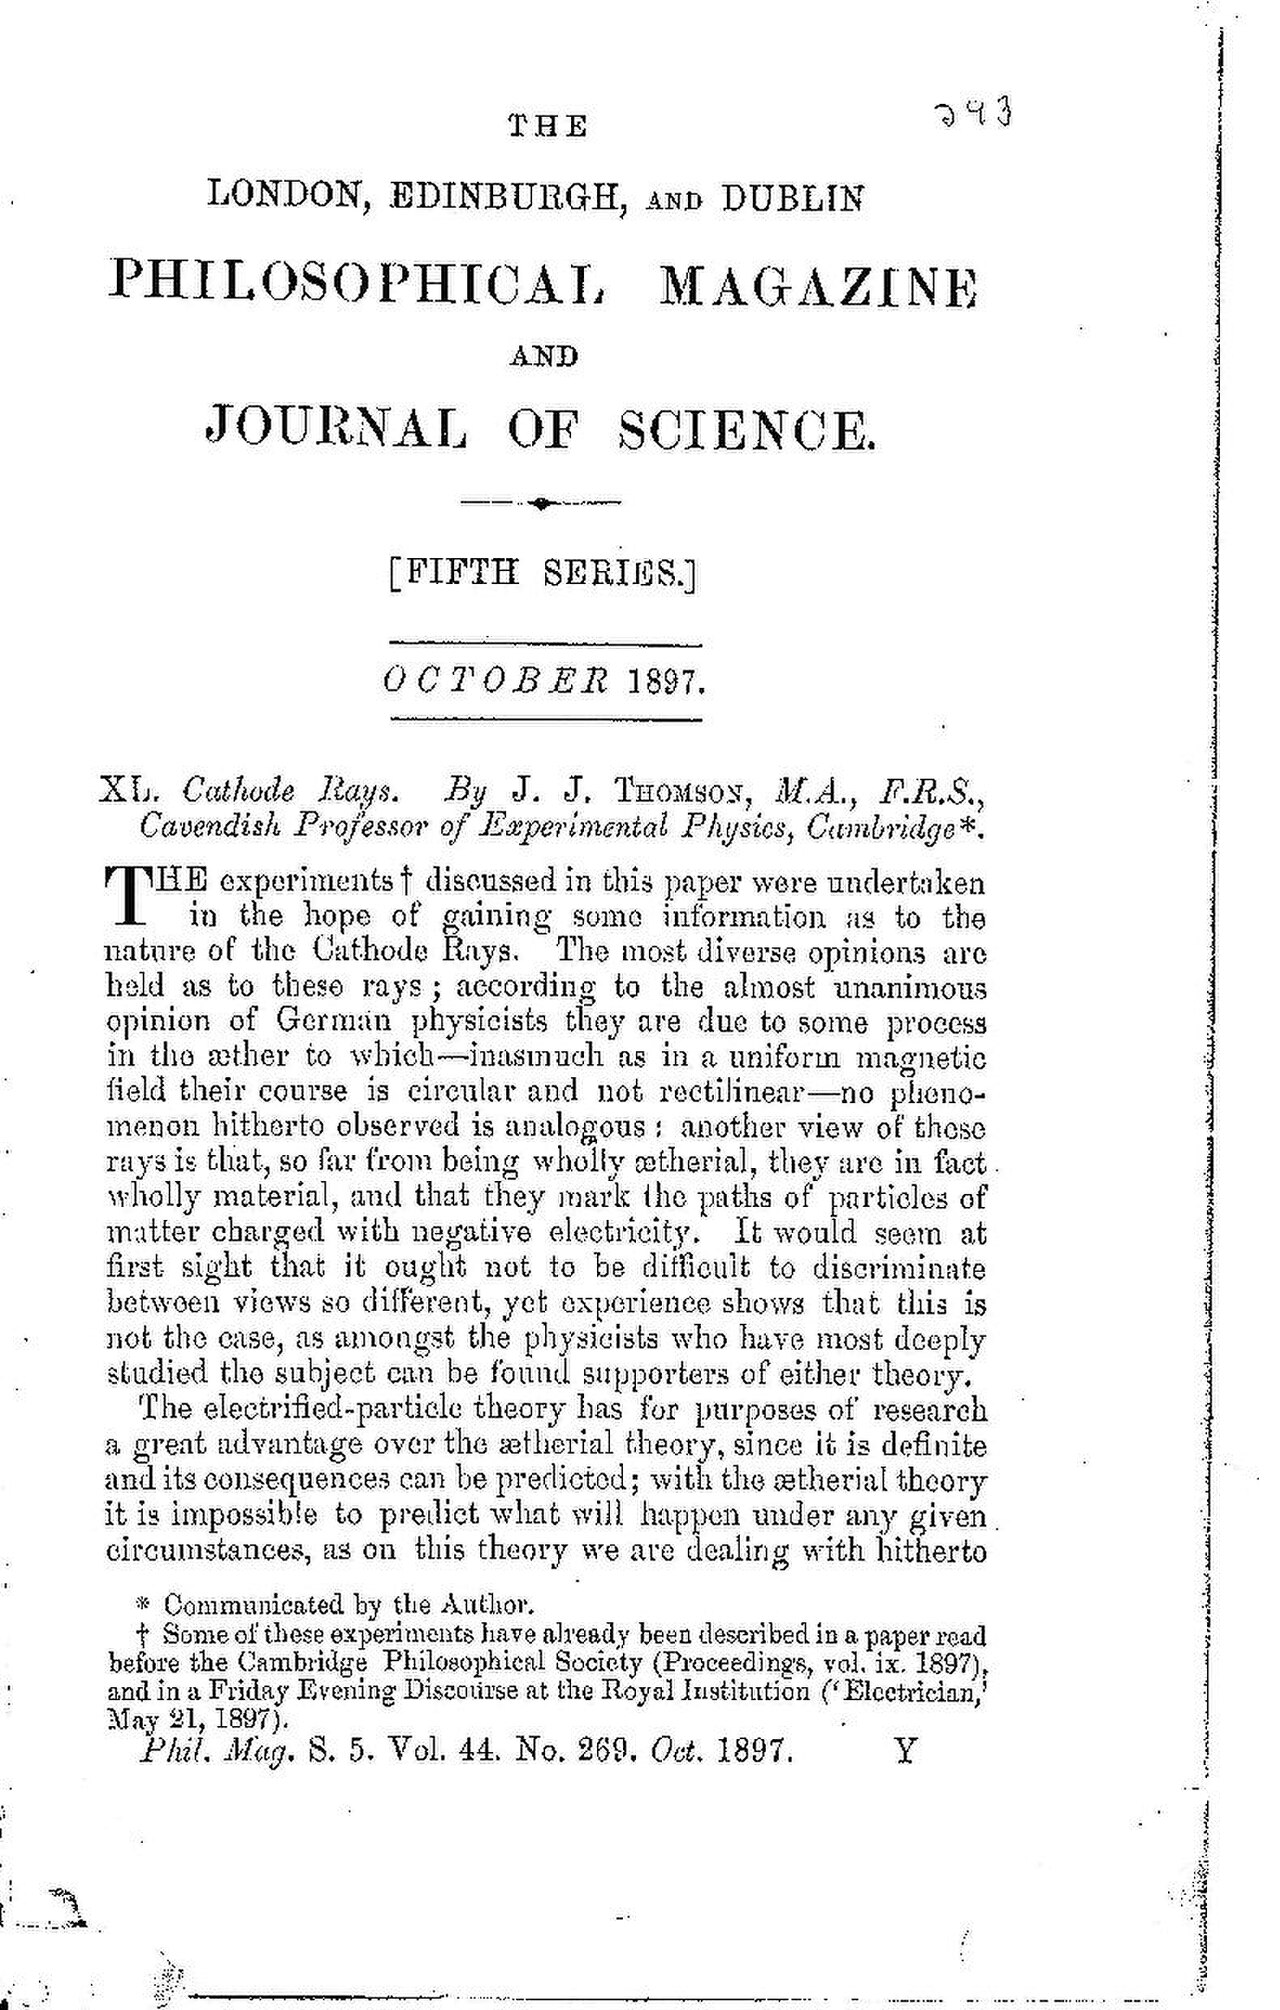 Document
Primary source
Cathode Rays
J. J. Thomson · October 1897
 Artifact
Primary source
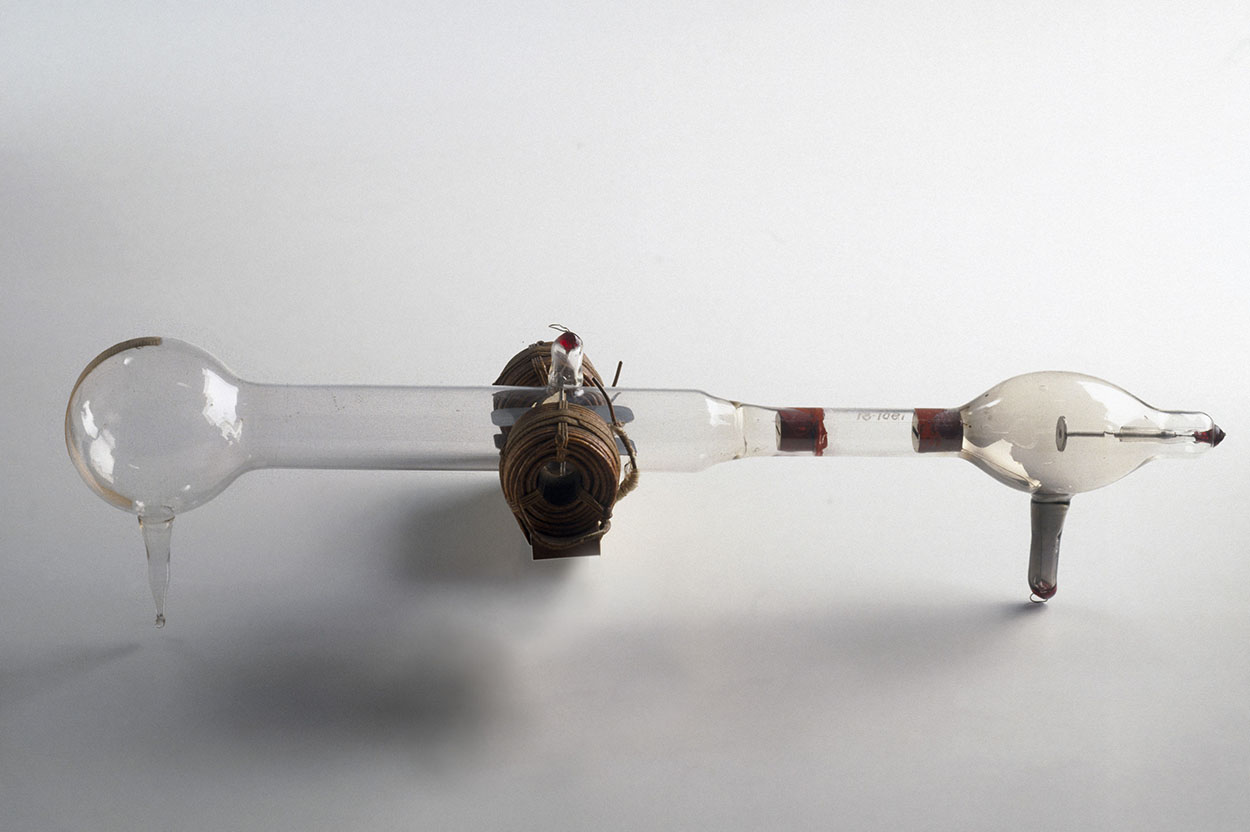
Cathode Ray Tube with Magnet Coils
1897
 Painting
Primary source
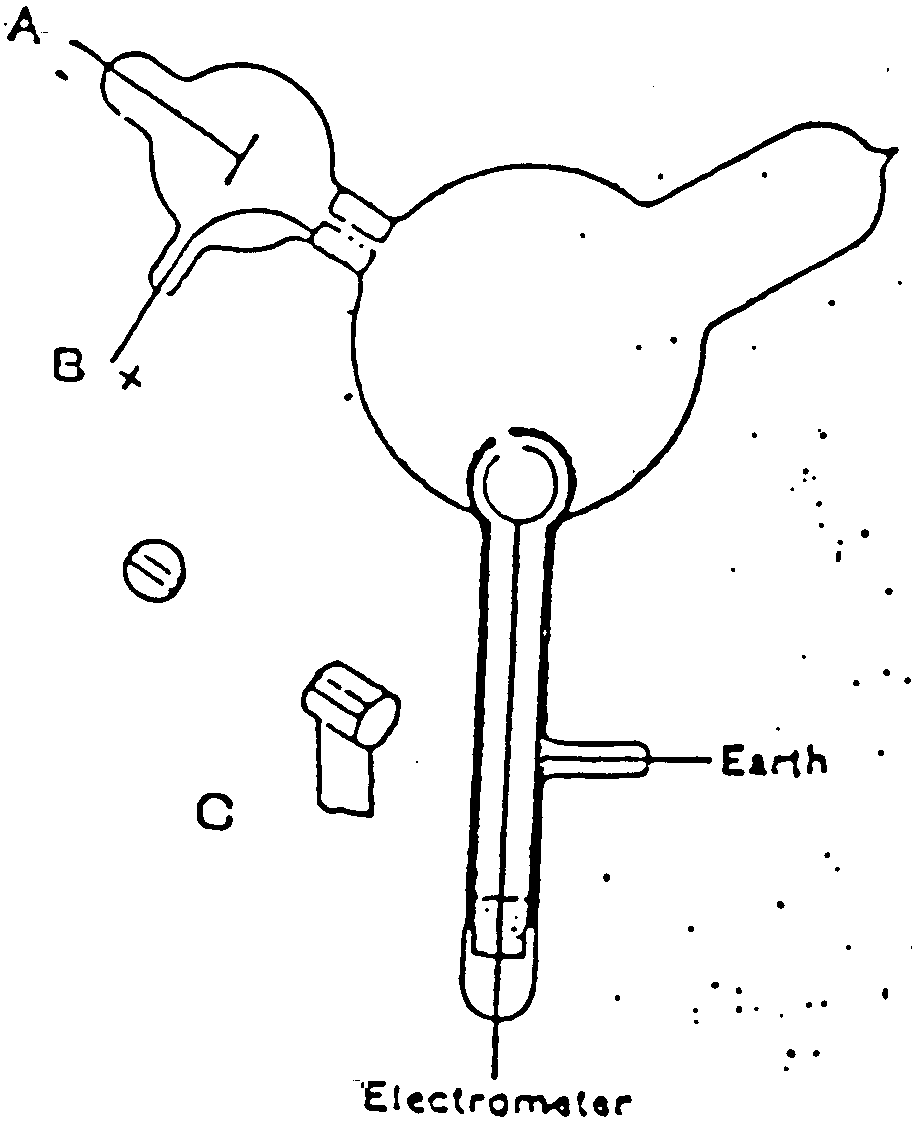
Cathode Ray Tube Diagram
J. J. Thomson · 1897
 Photograph
Primary source
Discovery of Neon Isotopes
Francis William Aston · 1912-1913
Free account
Read every J. J. Thomson source
Sign up free →
Ready when you are
Start chatting with J. J. Thomson now.
20 messages free · No credit card · Available in 50+ languages.