


Primary sourceArtifact1913
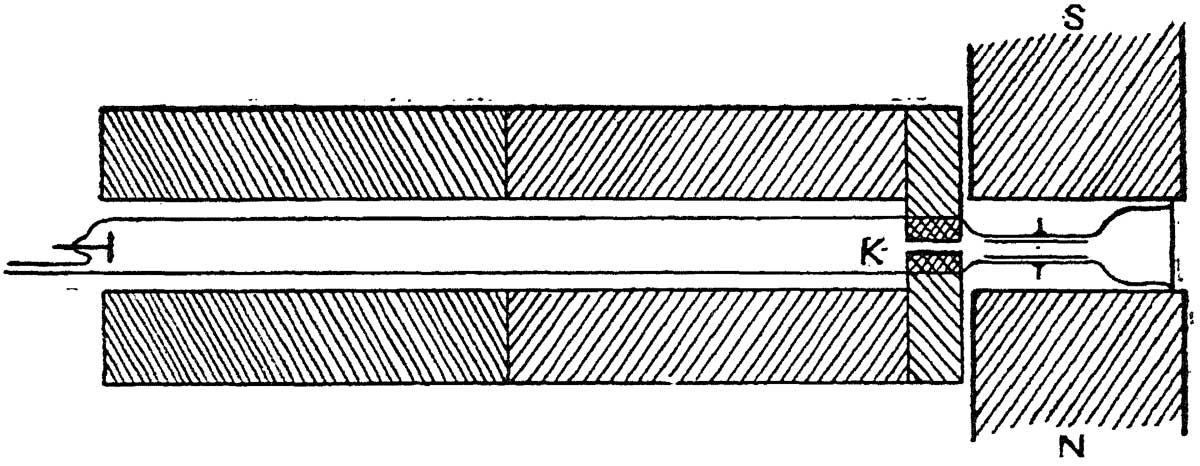
Positive-Ray Parabola Diagram, Figure 5
J. J. Thomson · 1913
A diagram from Thomson's 1913 monograph illustrating the positive-ray apparatus used to detect isotopes.
This diagram from Thomson's own 1913 monograph documents the apparatus he built to detect isotopes.
About this source
What it is
This is Figure 5 from Rays of Positive Electricity and their Application to Chemical Analyses, a 1913 book written by J. J. Thomson. The diagram shows a cathode ray tube apparatus with a cathode and magnetic pole pieces that produced the beams Thomson studied.
Why it matters
This diagram illustrates the apparatus behind Thomson's positive-ray method, which allowed him to detect particles of different masses within the same chemical element — an early demonstration of stable isotopes. It shows how careful experimental design, not just theory, drove major discoveries in early 20th-century physics.
Look closer
- What do the labelled parts of the diagram tell you about how the apparatus worked?
- Why might a scientist publish a diagram like this alongside written results?
- What does this diagram leave out about the actual experiment?
This artifact is part of the curated material that grounds the AI version of J. J. Thomson on Humy.ai — when students ask about related events, the AI can quote it and cite it.
More J. J. Thomson sources
Browse all 55 →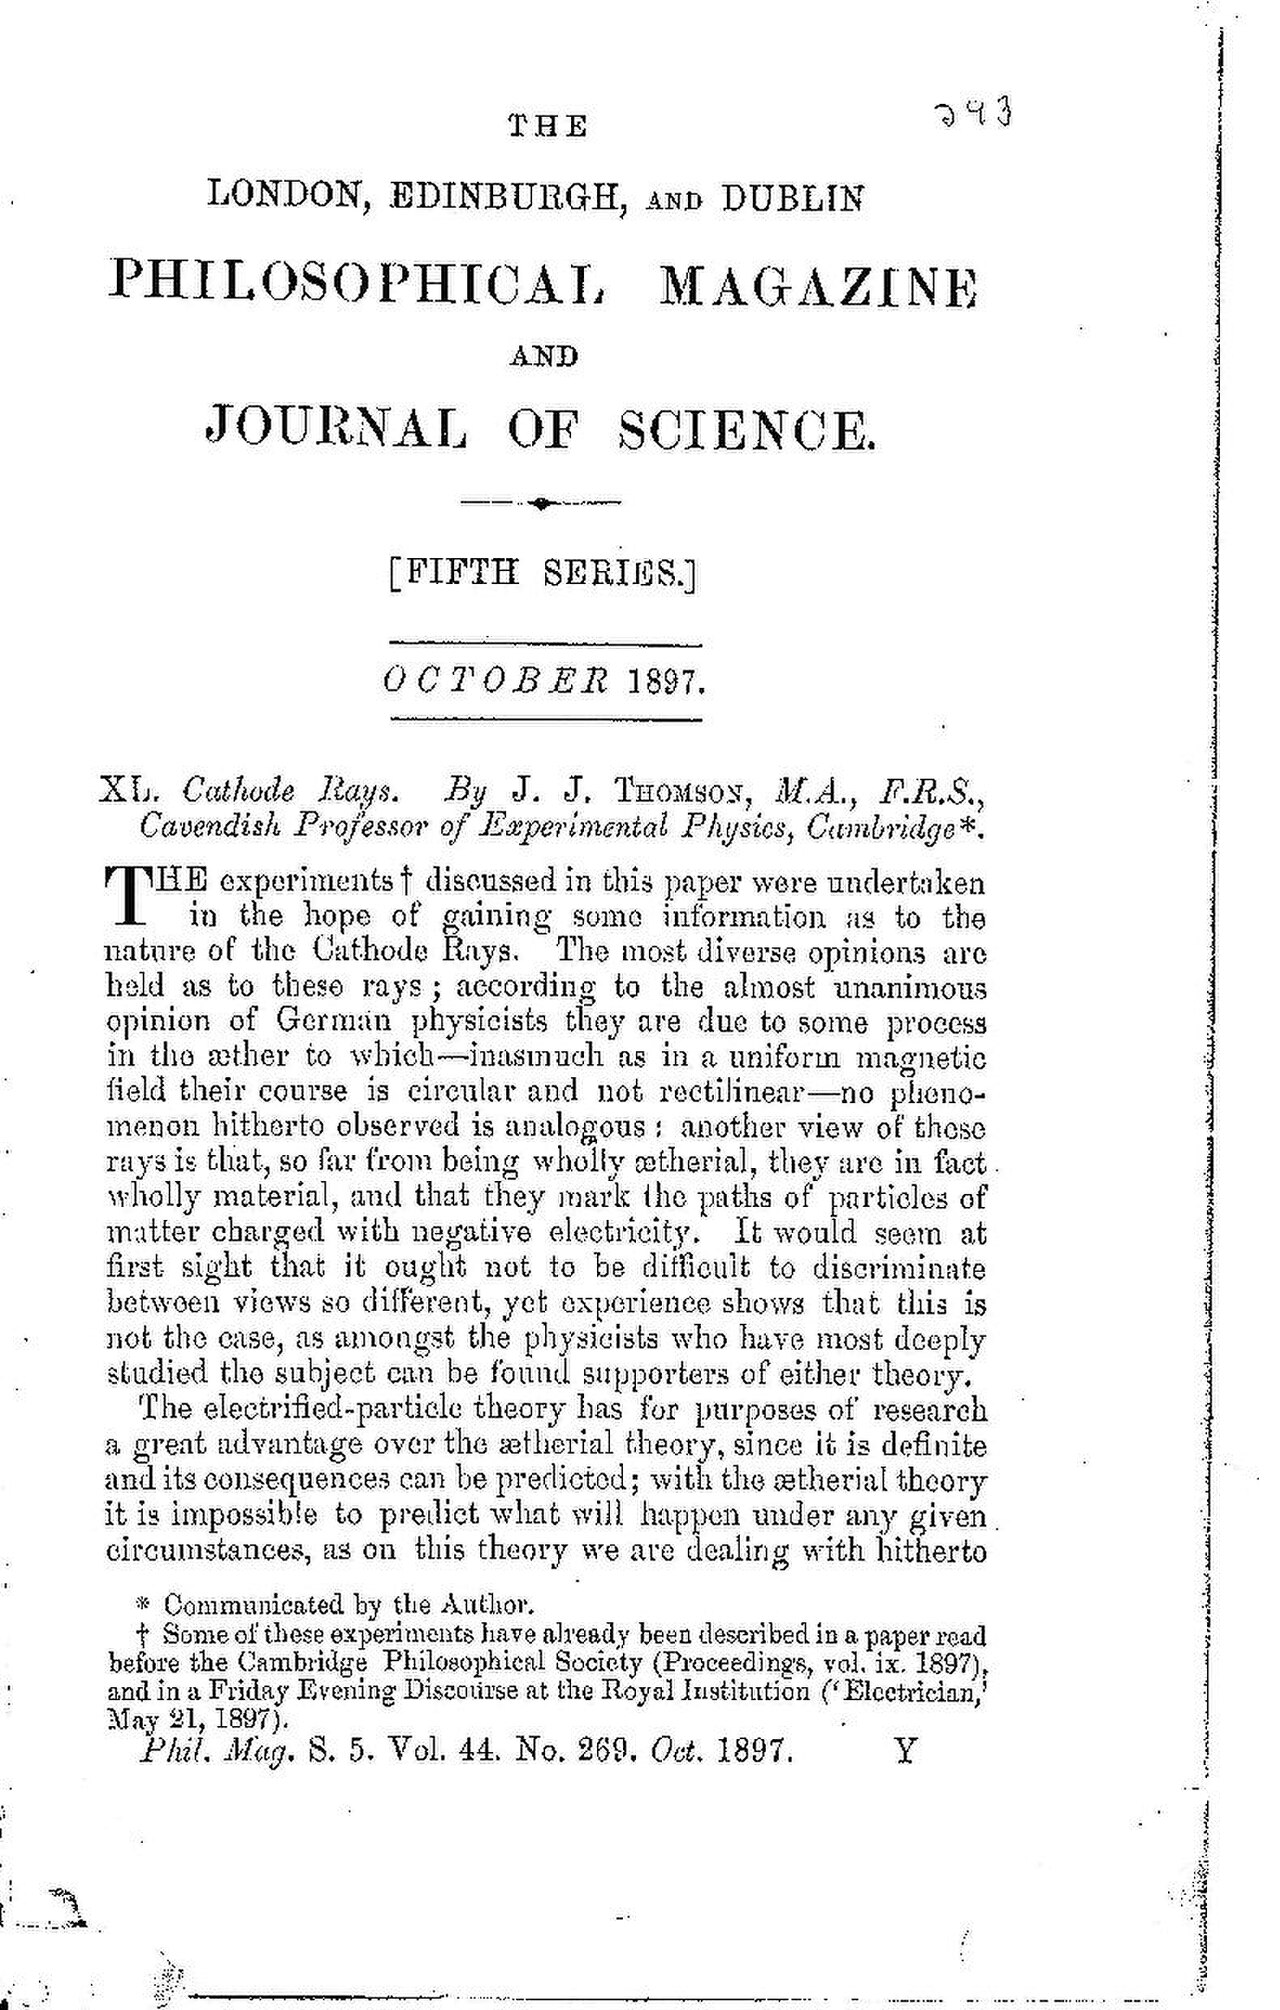 Document
Primary source
Cathode Rays
J. J. Thomson · October 1897
 Artifact
Primary source
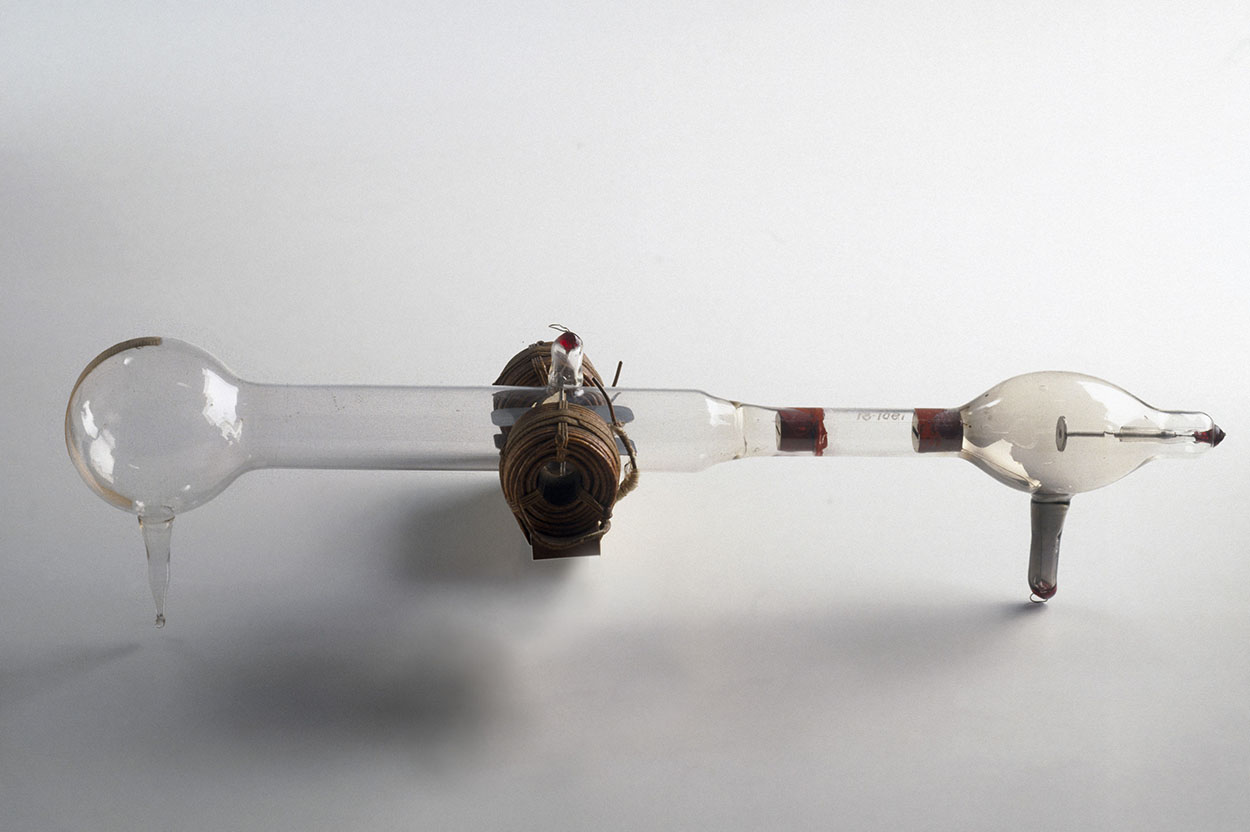
Cathode Ray Tube with Magnet Coils
1897
 Painting
Primary source
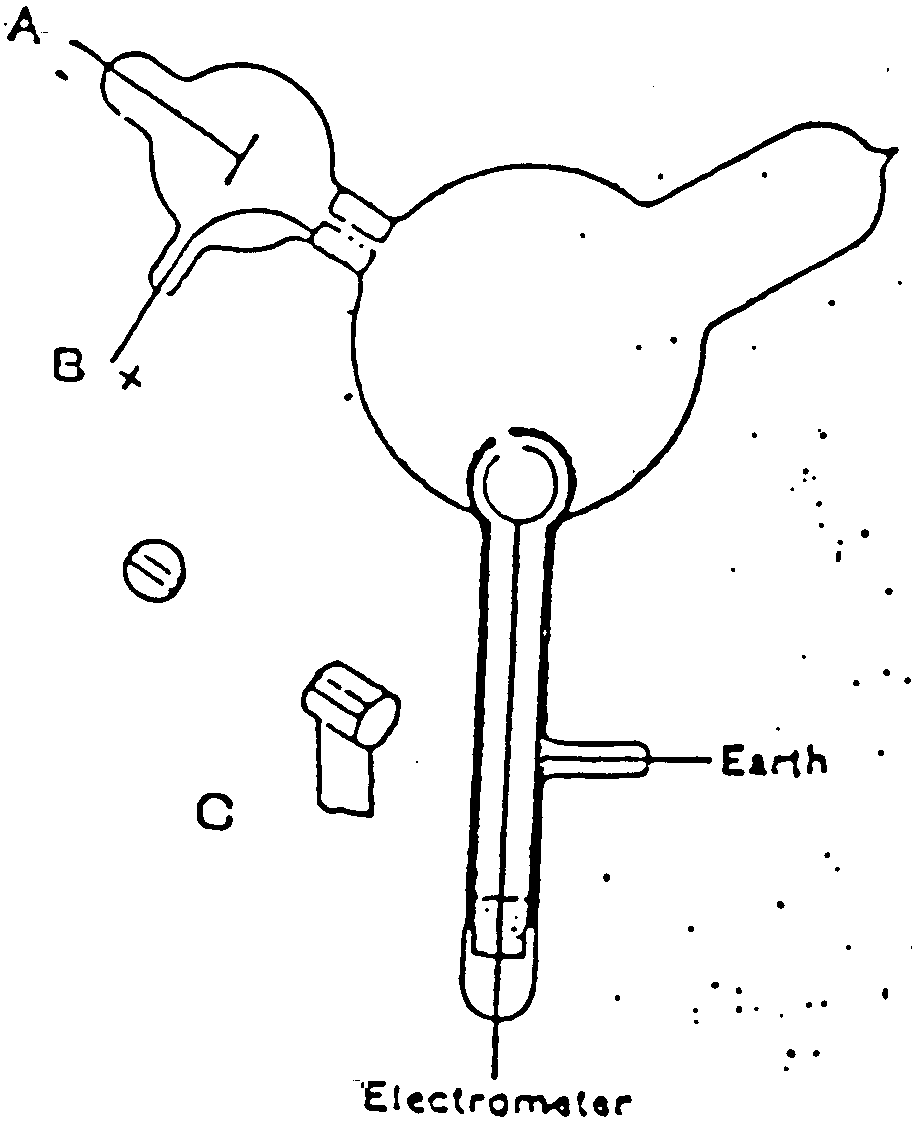
Cathode Ray Tube Diagram
J. J. Thomson · 1897
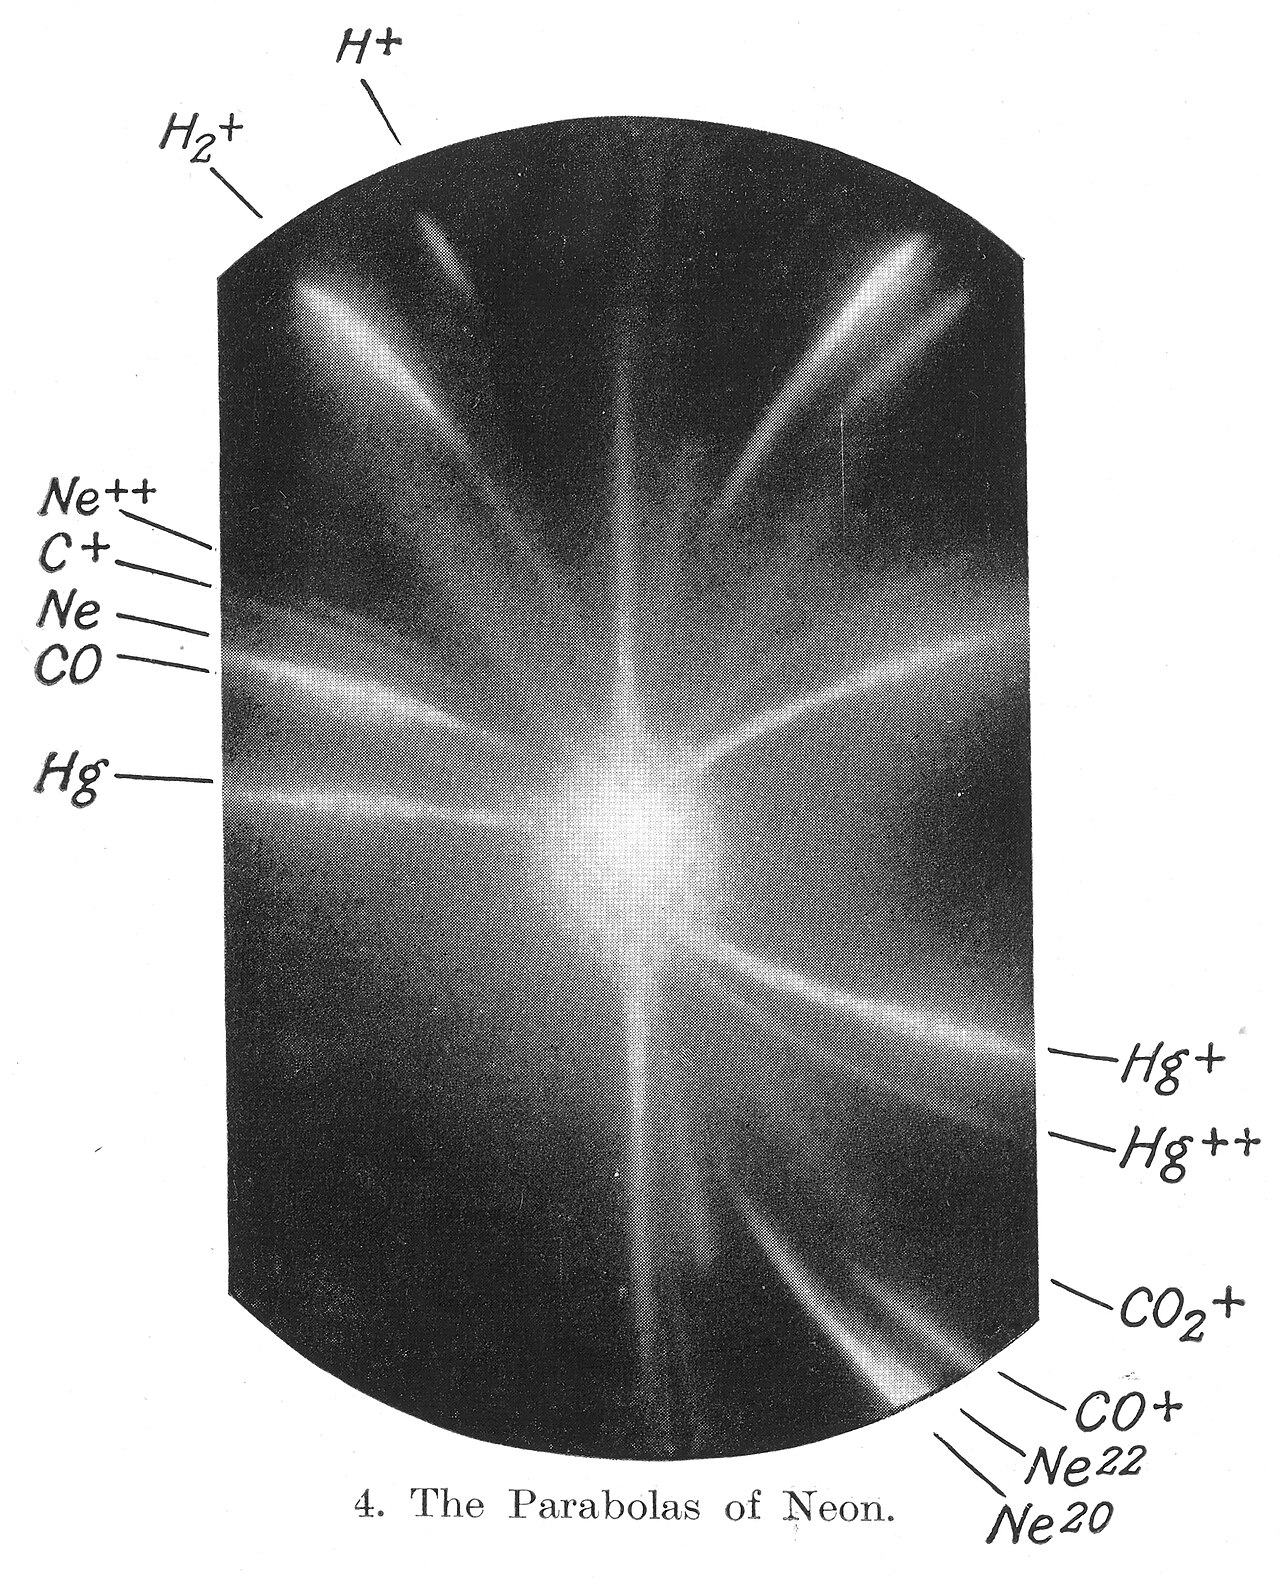 Photograph
Primary source
Discovery of Neon Isotopes
Francis William Aston · 1912-1913
Free account
Read every J. J. Thomson source
Sign up free →
Ready when you are
Start chatting with J. J. Thomson now.
20 messages free · No credit card · Available in 50+ languages.